Capital allocation is what management does with the cash the business produces: reinvest it, buy something, repay debt, pay a dividend, or repurchase shares. Over a multi-year holding period that split often moves per-share value more than revenue growth does. For a SIC thesis it is unusually good material, because unlike “strong management” it is checkable — every choice leaves a number in the cash flow statement.
The five doors cash can walk through
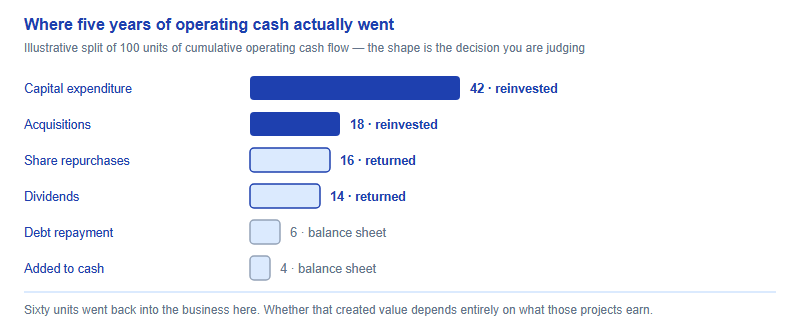
Start with the mechanics. A business generates operating cash. Management then decides where it goes, and there are only five destinations of any size: back into the existing operation as capital expenditure; out to buy another business; back to lenders as debt repayment; out to shareholders as dividends; or out to shareholders as share repurchases. Whatever is left sits on the balance sheet.
The reason this matters to a valuation is that two companies with identical operating performance can deliver completely different outcomes to an owner depending on that split. Cash poured into projects that earn less than the cost of capital destroys value while the income statement still shows growth. Cash returned through repurchases made at an inflated price destroys value while the share count falls. Neither shows up in a revenue chart, and neither is visible if your report treats management as an adjective rather than a set of decisions.
This is also why the topic works well in a competition report. In the drafts our editors read, we see a great many theses that assert quality — “an excellent management team with a strong track record” — and very few that prove it with five years of the company's own disclosures. Evidence that a reader can verify is precisely what the scoring rewards; if you have not read our breakdown of the SIC rubric, it explains why an attributable number outperforms a confident adjective.
Where the evidence lives
All of it is in documents you already have open. The cash flow statement is the primary source; the notes tell you whether the choices worked. Pull five years, never one — a single year of capex or repurchases tells you nothing about a pattern, and pattern is the whole point.
| What you want to know | Where to look | The line or item | What it tells you |
|---|---|---|---|
| Reinvestment in the existing business | Cash flow statement, investing section | Purchases of property, plant and equipment | How much capital the current operation absorbs to keep running and growing |
| Growth by purchase | Cash flow statement, investing section | Acquisitions, net of cash acquired | Whether growth is built or bought — a different risk profile entirely |
| Committed cash return | Cash flow statement, financing section | Dividends paid | A promise that is costly to break, which constrains future flexibility |
| Discretionary cash return | Cash flow statement, financing section | Repurchase of common stock | Gross cash spent buying back shares — not the same as shares retired |
| Balance sheet direction | Cash flow statement, financing section | Proceeds from and repayments of debt | Whether the company is levering up to fund the other choices |
| The net effect on you | Income statement and equity note | Weighted average diluted share count | Whether repurchases actually shrank the count after stock compensation |
| Whether past deals worked | Notes to the accounts | Goodwill and impairment note | Write-downs are management marking its own homework in public |
Five tests you can run in an afternoon
None of these needs anything beyond arithmetic. Treat each result as a question to take back into the filings, not as a verdict — a low number can be perfectly rational in the right industry, and the interesting work is finding out which.
- Reinvestment rate = (capital expenditure + acquisitions) ÷ operating cash flow, averaged over five years. This is the headline split: how much of what the business earns goes back in.
- Return on incremental capital = the change in operating profit after tax over five years ÷ the change in invested capital over the same period. It is crude, and the direction matters far more than the decimals: if the company has added a lot of capital and very little profit, that is the finding.
- Net share count change = diluted shares today versus five years ago, in percent. This is the only honest measure of whether buybacks reached the owner.
- Distribution coverage = (dividends + repurchases) ÷ free cash flow. Sustained readings above one hundred percent mean something else is funding the return — usually borrowing or asset sales. Go and find which.
- Acquisition scorecard = cumulative acquisition spend versus cumulative goodwill impairment, alongside whether the synergy targets announced at the time were ever revisited in later filings. Deals that quietly stop being mentioned are a finding in themselves.
Run all five and you will usually find one that looks strange. That anomaly is where your differentiated paragraph comes from — not because the number is dramatic, but because you can explain it and most readers of the same filing did not stop to compute it.
Reading buybacks honestly
Repurchases are where student analysis most often goes wrong, in two specific ways.
The first is confusing gross spend with net reduction. A company can spend heavily on repurchases and end the period with more shares outstanding than it started with, because share-based compensation was issuing new ones the whole time. The cash left, the owner's stake did not grow. Always pair the financing-section cash figure with the diluted share count trend; if the count is flat while the spend is large, the repurchase programme is functioning as employee compensation, and you should say so in exactly those words.
The second is forgetting that a buyback is an investment decision made at a price. Retiring shares below your estimate of intrinsic value transfers value to the holders who stay. Retiring them well above it does the opposite — it is not returning capital, it is spending capital badly, and the fact that the share count fell does not rescue it. Chart the years of heaviest repurchase against the share price over that period. Buying most aggressively into strength and stopping in a downturn is a common and revealing pattern.
Four patterns, and what each one implies
Cross the reinvestment rate against the return on incremental capital and you get four archetypes. Locating your company on this grid is a fast way to check whether the thesis you want to write is actually available to you.
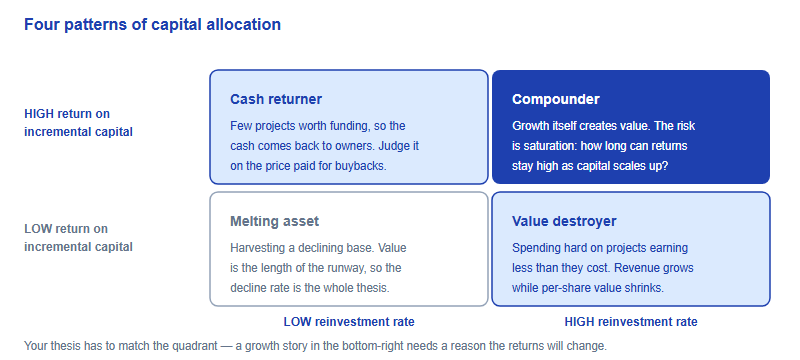
The most common student error is writing a compounder thesis about a bottom-right company. If the numbers say heavy reinvestment at falling returns, you have three honest options: argue the returns are about to improve and show why, argue the market has already over-punished it, or pick a different company. What you cannot do is describe the growth and skip the returns.
Writing it into the thesis, and where the lens stops
Compress the whole analysis into two or three sentences in the report body, and put the supporting five-year table in an exhibit. Compare these:
- Weak: “Management has a strong track record of disciplined capital allocation and is committed to shareholder returns.”
- Strong: “Over the last five reported years the company directed roughly six of every ten dollars of operating cash back into the business, while operating profit after tax grew by less than the invested capital base — and the diluted share count is higher today than it was five years ago despite repurchases. The thesis therefore requires the incremental return to improve, which is what the next section addresses.”
The second version tells a judge exactly what you checked, where the number came from and what it obliges you to prove next. It also gives you a natural entry in the risk section: a large, poorly-priced acquisition is a specific, nameable event that would break the case, which is far more useful than a generic paragraph about execution risk.
Two limits, stated honestly. The lens is weak on pre-profit and early-stage companies, where the useful questions are how the cash raised is being spent and how long the runway lasts, not the return on incremental capital. It also understates investment at capital-light businesses, where the real spending runs through the income statement as research or customer acquisition rather than appearing as capex — comparing a software company's capex ratio with a manufacturer's is meaningless without that adjustment. And be careful comparing payout ratios across markets: dividend conventions, tax treatment and ownership structures differ enough by listing venue that a raw cross-border comparison misleads. Flag those as analytic cautions, not as claims about any particular issuer.
If you are new to the competition and wondering where this sits in the season, our guide to what the SIC is sets out the stages and deliverables; report formats and length limits are set by the rules each season, so confirm the current ones on the official SIC site before you plan how much of this to include.
FAQ
Is capital allocation only relevant for mature companies?
Mostly. For a pre-profit company the useful version is how the cash raised is being spent and how many quarters of runway remain.
Where do I find buyback data?
The financing section of the cash flow statement gives the cash spent; the diluted share count gives the net effect after stock compensation.
Do dividends make a stock safer?
Not by themselves. A payout funded by borrowing or asset sales is a warning sign, so always check coverage against free cash flow.
How many years of data do I need?
Five is a sensible default. One year of capex or repurchases says almost nothing about how management behaves over a cycle.
Published by the SIC editorial desk, operated by Hanlin Education for China-based international-school students. Official rules are set by the competition and change from year to year — confirm current details on the official SIC site. Errors are corrected within 7 working days.