Direct Answer: SIC Leverage Magnifies Equity Loss, Not Just Return
In the Student Investment Challenge (SIC) S16 season, participants receive US$100,000 in virtual principal for online simulated trading in US and HK markets. The Hanlin Course source note lists short selling, leverage, and position management as part of that simulated trading experience. For SIC teams using borrowed exposure, the central fact is that SIC leverage does not only scale upside — it scales the rate at which equity erodes when the underlying position moves against you. A 20% decline in a 1.5x position consumes 30% of the equity behind it. This article treats leverage as a margin-erosion problem and supplies a pre-trade stress test that any SIC team can run before committing virtual capital.
What the S16 Source Says About Simulated Trading
According to the Hanlin Course WeChat public account article titled “2027 SIC Investment Competition Opens S16 New Season! US$100,000 for You to Operate” (published 17 September 2026), S16 provides US$100,000 in virtual principal and invites participants into online simulated trading set against real US and HK market data. The same note lists short selling, leverage, and position management among the trading experiences it promotes. A second Hanlin Course note, “SIC S16 Autumn Season is Here! Investing in Practice for Grades 6–12” (published 19 October 2026), distinguishes the two divisions: the Senior Division combines online simulated trading with a written investment strategy report, while the Junior Division is online simulation and trading only. What the notes do not provide is any exact maintenance-margin percentage or forced-liquidation threshold. Those numbers are platform parameters, and treating them as a fixed contest rule would be a mistake. Everything that follows about margin mechanics is offered as a teaching framework, not as an official SIC rule.
Leverage vs. Short Selling: Different Failure Modes, Different Diagnostics
Leverage and short selling both involve borrowing, but they fail in different ways. SIC Short Selling Risks: How to Size Positions and Define Stops in Simulation describes theoretically unbounded loss if the price rises without limit. Long leverage does not carry an unbounded loss on the position itself — a stock cannot fall below zero — but the equity behind a leveraged long can be wiped out by a modest percentage decline because the debt does not shrink with the price. That difference means the diagnostic tests are not interchangeable. A short-position stress test focuses on upside gaps and borrow availability; a leveraged-long stress test focuses on the price at which equity falls below the maintenance threshold and how quickly the position recovers afterward. Scenario thinking, laid out in the article on SIC Scenario Analysis: Showing How a Valuation Changes When Assumptions Fail, applies to both, but the inputs differ.
How the Leverage Ratio Shapes Equity Loss
Leverage ratio here means total position value divided by your own equity. If a team deploys $100,000 of equity and the platform lends $50,000, the position is $150,000 and the leverage ratio is 1.5x. For a position held open without adding cash, the equity impact of a given price move is approximately the price change multiplied by the leverage ratio. The table below isolates that relationship at four common leverage ratios for the same $100,000 of starting equity.
| Leverage | Equity | Borrowed | Position | Equity impact of -10% price move | Equity impact of -20% price move |
|---|---|---|---|---|---|
| 1.0x | $100,000 | $0 | $100,000 | -10% | -20% |
| 1.5x | $100,000 | $50,000 | $150,000 | -15% | -30% |
| 2.0x | $100,000 | $100,000 | $200,000 | -20% | -40% |
| 3.0x | $100,000 | $200,000 | $300,000 | -30% | -60% |
The relationship becomes painful in the drawdown tail: even if the leverage ratio itself is constant, the percentage of remaining equity consumed by the next equal-sized price decline keeps growing, because the equity base has already shrunk. That is the compounding problem leverage creates in a short competition window.
Worked Teaching Illustration: The Math of Margin Erosion
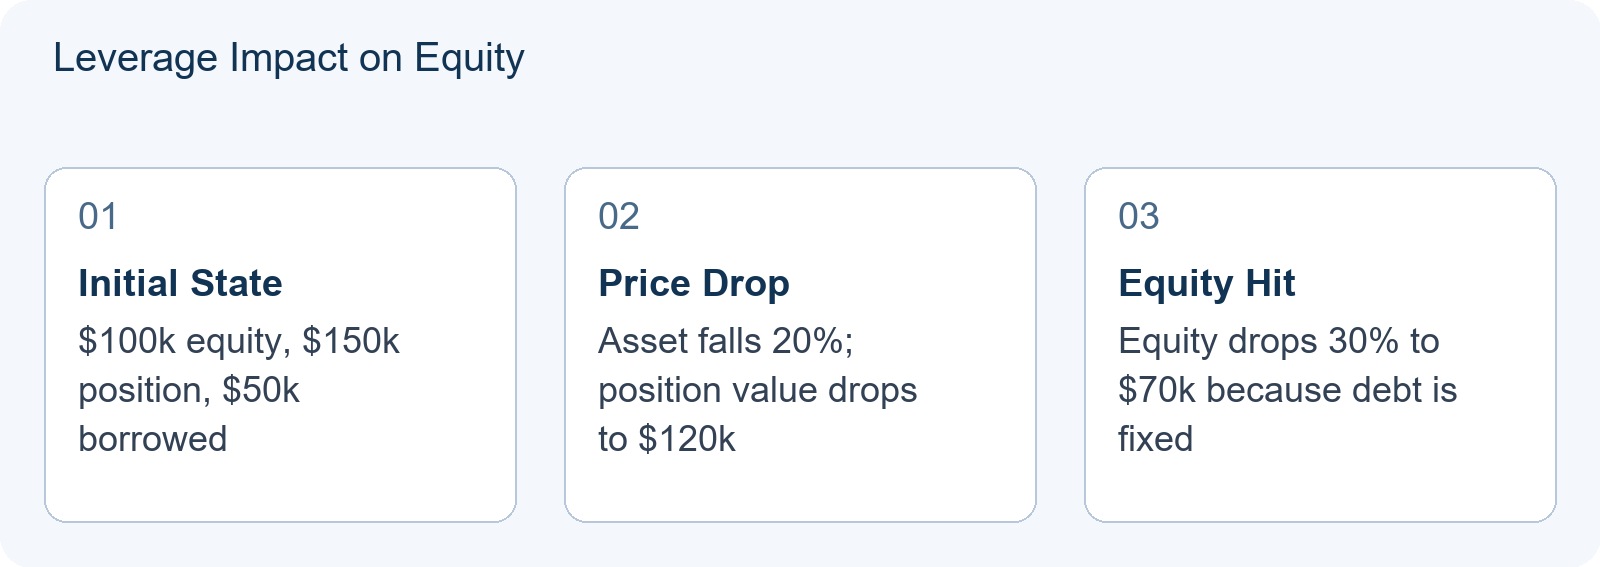
The following is a teaching illustration, not an SIC contest problem or an official scoring guideline. A team holds $100,000 of equity and opens a $150,000 position in a volatile technology stock, borrowing $50,000. The leverage ratio is 1.5x. The debt is fixed at $50,000 until the position is closed, so any change in the position’s market value lands entirely on the equity side.
| Scenario | Price change | Position value | Debt (fixed) | Equity remaining | Equity change |
|---|---|---|---|---|---|
| Start | 0% | $150,000 | $50,000 | $100,000 | 0% |
| Mild decline | -10% | $135,000 | $50,000 | $85,000 | -15% |
| Significant drop | -20% | $120,000 | $50,000 | $70,000 | -30% |
| One-third drop | -33.3% | $100,000 | $50,000 | $50,000 | -50% |
At the -33.3% line, half of the original equity is gone and the remaining equity exactly equals the debt. Beyond that point, further declines push equity below the debt, which is the region where platforms typically act. Notice that the position itself only fell by one-third; equity fell by half. That asymmetry is the entire reason pre-trade stress testing exists.
Where a Margin Call Would Hypothetically Arrive
This section is again a teaching framework; the actual SIC simulation parameters may differ, and teams must consult the official platform documentation for current technical numbers. A common illustrative maintenance margin is 25% of position value, meaning equity must stay at or above one quarter of the position’s current value. Under that assumption, the same 1.5x position would trigger a maintenance call when:
Equity = Position value − Debt ≥ 0.25 × Position value
0.75 × Position value ≥ $50,000
Position value ≥ $66,667
The position would have to fall about 55.6% — from $150,000 down to roughly $66,667 — before the assumed maintenance margin was breached. Run the same calculation with 3x leverage ($300,000 position, $200,000 debt) and the trigger arrives at a position value of $200,000 ÷ 0.75 = $266,667, which is only an 11.1% decline from the starting $300,000. The lesson is that the leverage ratio does not just magnify the loss; it determines how close the maintenance trigger sits to the entry price. A team that has 55% of headroom at 1.5x has about 11% of headroom at 3x, for the same asset. Reading the assumed percentage as a real platform rule would be a serious mistake; the point of the calculation is to build the discipline of testing whatever parameters the platform actually publishes.
Margin Stress-Test Checklist
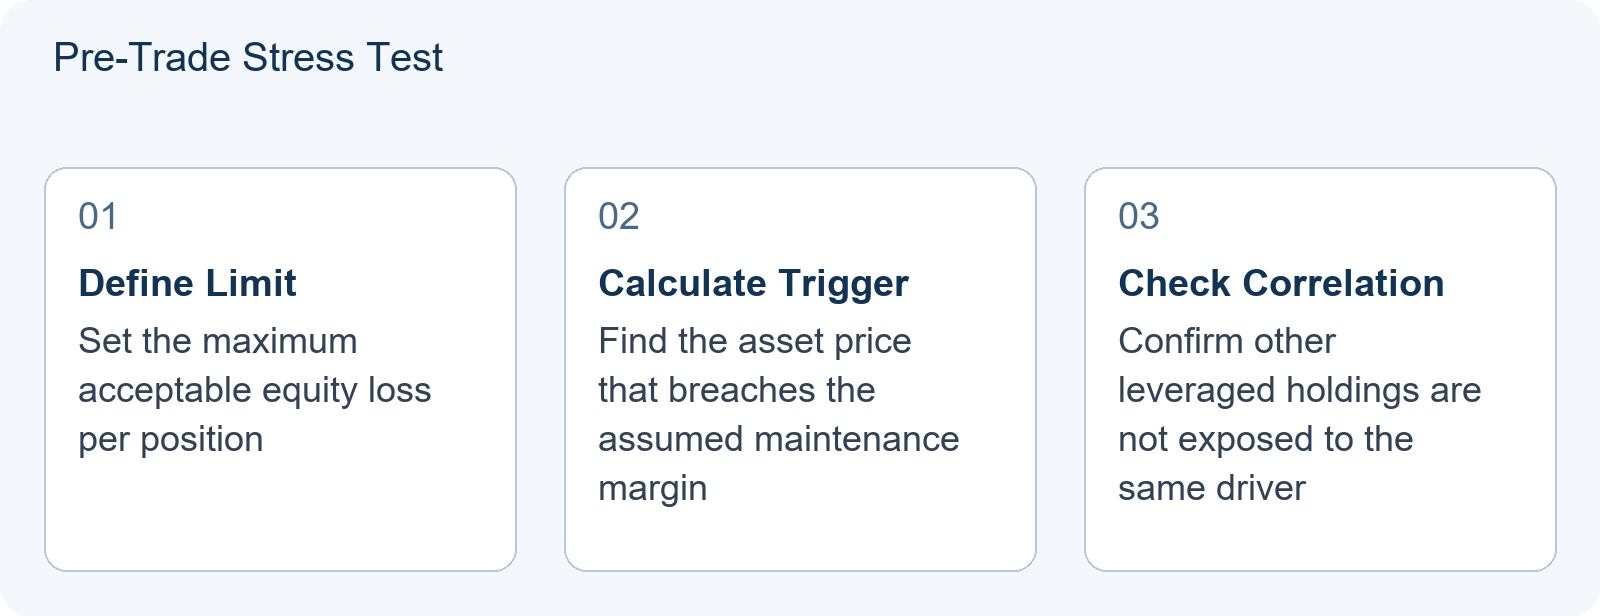
Before entering any leveraged position in the SIC simulation, work through these five questions. Each is a pre-trade decision aid, not a contest rule.
- Maximum tolerable equity drawdown. Decide in advance how much of the team’s virtual equity you are willing to risk on a single position — for example, 15% or 20%. That number drives every other decision.
- Maintenance-trigger price. Under your assumed maintenance percentage, calculate the exact asset price at which equity would fall below the threshold. If that price is inside the stock’s recent one-month range, the position is over-leveraged for that asset’s volatility.
- Recovery mathematics. After a 30% equity loss, you need a 42.9% gain on the remaining equity just to return to the starting value. After a 50% loss, you need 100%. High leverage pushes the recovery requirement up steeply.
- Correlation exposure. If two or more leveraged positions depend on the same macro driver — a rate move, a sector rotation, an FX shift — a single market event can push several positions toward the maintenance threshold at once. Add their exposures before deciding how much capacity remains.
- Time to recovery. In a short competition window, a leveraged position that might recover over six months may not recover before the trading stage closes. Size the position to the horizon, not to the thesis alone.
Diagnostic: Right Thesis, Wrong Timing
A persistent mistake in simulated investing is being fundamentally correct about a company and still being forced out by bad timing. Leverage makes that trap worse because the position can hit a maintenance threshold before the thesis has had a chance to play out. A useful pre-trade question is: “If this stock oscillates for three or four weeks without following my thesis, will I still be holding it?” If the answer is no, the leverage ratio is too high for that asset’s short-term noise, regardless of how strong the underlying argument is. Senior Division teams can also write that diagnostic into the investment strategy report as part of the position-sizing rationale — reviewers tend to respond to a team that has clearly considered the failure path, not only the upside path.
Writing About Leverage Risk in a Senior Division Report
Senior Division evaluation combines the simulated trading record with a written investment strategy report, so teams should not treat leverage as a private trading decision. The report is a place to explain the reasoning explicitly: why a particular leverage ratio fit the asset’s historical volatility, what the team’s maintenance-margin stress test showed, and what specific evidence would justify reducing or closing the position. The mechanics that support that explanation overlap with the model-hygiene guidance in The Spreadsheet Behind Your SIC Valuation: Model Hygiene, Assumptions and Sensitivity Tables (2026) — a clean sensitivity table is often more persuasive than a paragraph of prose about risk. Avoid presenting leverage as a way to amplify returns; present it as a conditional commitment of equity with a clearly defined failure point.
Course-Fit and Resource Preparation
Understanding leverage well requires comfort with financial mathematics, balance sheet mechanics, and scenario planning. Hanlin’s published SIC course material covers topics such as financial reporting mechanics, balance sheet and cash flow interpretation, market organisation and efficiency, industry and company analysis, and equity valuation with Excel-based modelling — the same building blocks a team needs to compute margin erosion on its own. No course guarantees standing in the SIC simulation, and none replaces the platform’s own documentation. The practical question for a team considering preparation is whether its members can independently build a margin-erosion table and a maintenance-trigger price for a specific position; if they cannot, guided practice will pay off faster than trial and error with virtual capital.
General event background is available at Event background.
Frequently Asked Questions
Does SIC publish specific maintenance-margin percentages or forced-liquidation thresholds?
The supplied Hanlin Course source notes list leverage as part of the S16 simulated trading experience but do not specify exact maintenance-margin percentages or forced-liquidation prices. This article treats those figures as teaching assumptions. Teams should consult the official SIC platform documentation for the current technical parameters before sizing a real simulated position.
Is the worked example based on a real SIC contest problem?
No. The calculation showing a 20% asset decline leading to a 30% equity loss is a labelled teaching illustration designed to demonstrate the arithmetic relationship between leverage and equity erosion. It is not an SIC contest problem, and it is not official scoring guidance.
Can Junior Division participants use leverage in the simulation?
The Hanlin Course source notes state that the Junior Division involves online simulation and trading only, and that the Senior Division combines simulation with an investment strategy report. The notes do not state whether Junior Division accounts have access to the same leverage features as the general simulation environment, so teams should verify directly on the official SIC platform rather than assume either way.