For students preparing for the Student Investment Challenge (SIC), particularly in the Senior Division strategy track, a common pitfall is presenting a valuation that relies on a single set of optimistic inputs. Judges often look for robustness: what happens if your core assumption fails? This article focuses specifically on SIC scenario analysis, distinguishing it from general preparation advice found in our The Spreadsheet Behind Your SIC Valuation: Model Hygiene, Assumptions and Sensitivity Tables (2026). We will walk through two hypothetical cases—one correct approach and one common error—to demonstrate how to identify fragile assumptions and model their impact.
The Core Difficulty: Static vs. Dynamic Valuation
A static valuation assumes all variables hold true. A dynamic scenario analysis acknowledges uncertainty. In SIC reports, this means explicitly stating which assumptions are most critical to your target price or return projection. If you assume a company’s revenue grows at 10% annually but provide no alternative view for 5% growth, your analysis lacks depth. The goal is not to predict the future perfectly, but to show you understand the levers that drive value.
Teaching Illustration 1: The Fragile Growth Assumption (Correct Approach)
Consider a student analyzing a mid-cap technology firm. Their base case assumes a new product launch will capture 15% market share within two years, driving a 20% EPS increase. They calculate a fair value of $50 per share based on this growth.
The Failure Point: What if the launch is delayed by six months due to supply chain issues? Or what if competitors release similar features first?
Scenario Adjustment: Instead of ignoring this, the student creates a “Downside Scenario.” They reduce the market share capture to 5% and delay the revenue recognition by one year. Recalculating the DCF model with these adjusted inputs yields a fair value of 50 (Base) and $35 (Downside), the report demonstrates awareness of execution risk. The judge sees that the student understands the sensitivity of the valuation to timing and adoption rates.
Teaching Illustration 2: The Interest Rate Sensitivity (Correct Approach)
Now consider a student analyzing a utility company with high debt levels. Their base case uses a weighted average cost of capital (WACC) of 6%, assuming stable interest rates. They project a steady dividend yield and arrive at a target price of $40.
The Failure Point: Central banks raise benchmark rates by 1%. This increases the company’s borrowing costs and raises the discount rate applied to future cash flows.
Scenario Adjustment: The student models an “Interest Rate Shock” scenario. They increase the WACC to 7.5% and adjust the debt service coverage ratio downward. The recalculated fair value drops to $32. This example highlights how macroeconomic factors directly impact micro-level valuations. It shows the student can link broader economic trends to specific financial metrics in their chosen stock.
Teaching Illustration 3: The Broken Scenario—Mentioning Risk Without Recalculation (Common Error)
Here is where many SIC reports stumble. A team might mention that “interest rates could rise” but then fail to recalculate any numbers. They leave the $40 target unchanged while adding a vague warning. This is worse than no scenario at all: it signals awareness of risk without analytical follow-through.
The mistake is treating scenario analysis as a rhetorical device rather than a quantitative exercise. Judges can distinguish between a team that understands sensitivity and a team that merely names risks. The fix is simple: every named risk must flow through to a revised valuation or a clear abandonment of the thesis.
Diagnostic Table: Identifying Fragile Assumptions
To help you spot weak points in your own SIC reports, use this simple diagnostic framework. Ask yourself these questions about each major input in your valuation model.
| Assumption Type | Question to Ask | Red Flag Indicator |
|---|---|---|
| Growth Rates | Is this growth higher than industry averages without clear justification? | No competitive moat explained; relies solely on “market expansion.” |
| Margins | Do margins improve while competitors’ margins stay flat? | Unexplained operational efficiency gains; ignores inflationary pressure. |
| Discount Rate | Is the WACC lower than peers with similar risk profiles? | Underestimating beta; ignoring country-specific risk premiums. |
| Capital Expenditure | Are capex needs underestimated to boost free cash flow? | Ignoring maintenance requirements; assuming one-time investments suffice. |
Targeted Practice Sequence
Improving your scenario analysis skills requires deliberate practice. Follow this sequence before finalizing your SIC strategy report:
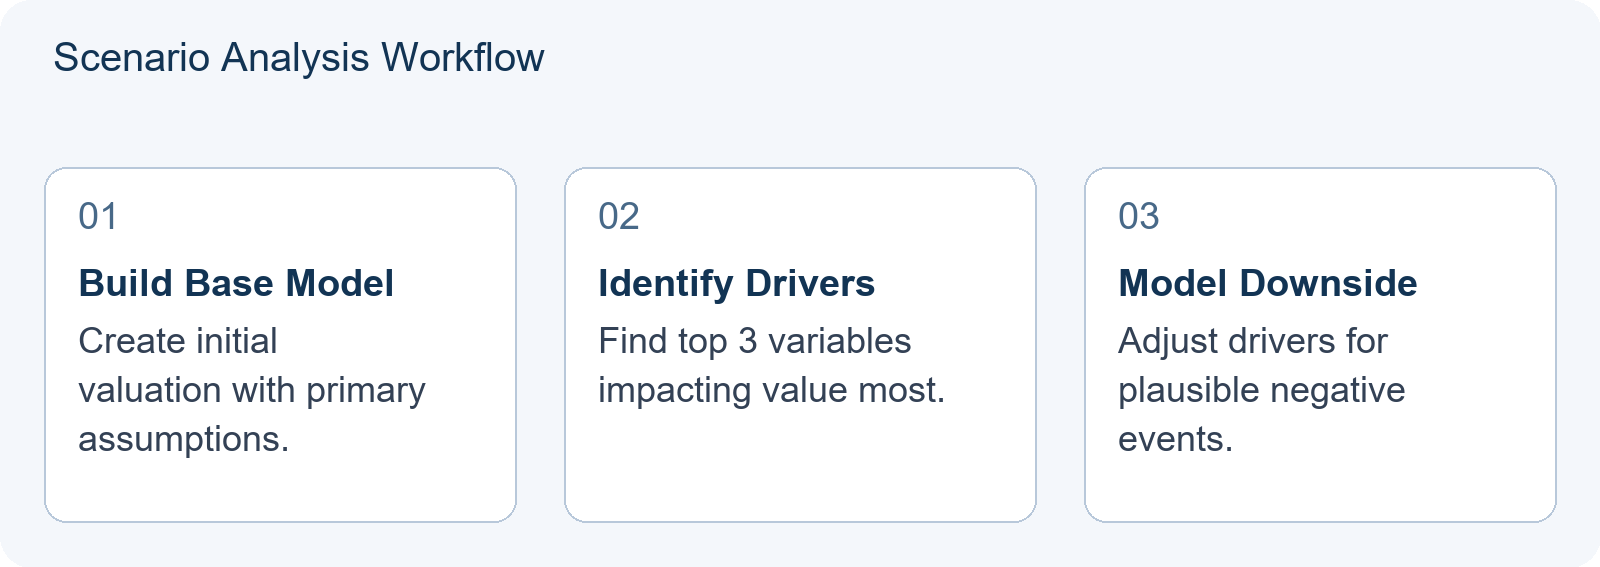
- Step 1: Build the Base Case. Complete your standard valuation model using your most likely assumptions.
- Step 2: Identify Top Three Drivers. Use a sensitivity table to find which three variables change the output value the most. These are your key assumptions.
- Step 3: Create Downside Scenarios. For each key driver, define a plausible negative event (e.g., regulatory change, supply disruption). Adjust the variable accordingly.
- Step 4: Re-evaluate Thesis. Does your investment thesis still hold in the downside scenario? If yes, why? If no, what is your exit strategy?
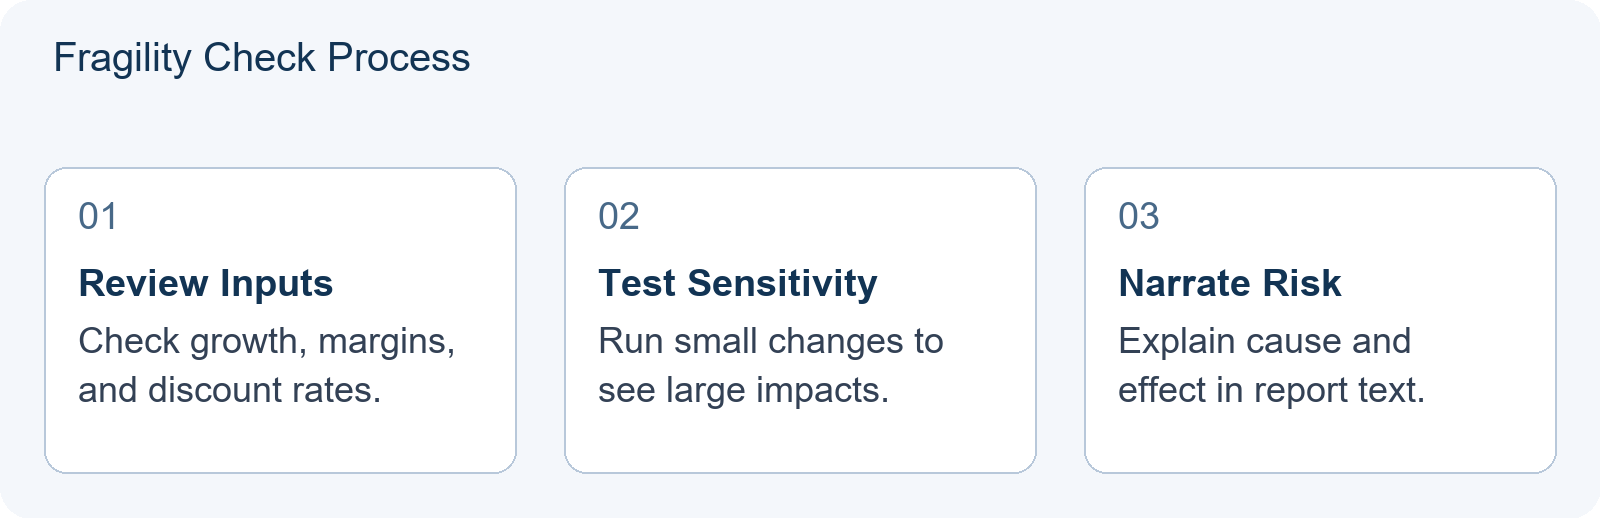
- Step 5: Document the Logic. Write a brief section in your report explaining these scenarios. Do not just list numbers; explain the narrative behind the changes.
For guidance on how standard valuation tools behave differently across sectors, see our article on When the Standard Valuation Toolkit Breaks: Analysing Banks, REITs, Biotech and Cyclicals for SIC. Understanding sector-specific exceptions helps you create more realistic scenarios.
Demonstrating Skill Next Time
The specific skill a learner should be able to demonstrate next is the ability to articulate why a particular assumption is fragile and how they would mitigate that risk. It is not enough to say “revenue might drop.” You must say, “Revenue might drop because competitor X launched a cheaper alternative, which would reduce our pricing power by 10%, leading to a 15% decrease in EBITDA margin.” This level of specificity transforms a generic warning into a sophisticated analytical insight.
Remember, SIC evaluation focuses on academic rigor and process, not rank-based prizes. Showing you have thought through failure modes demonstrates maturity and deep understanding. For guidance on structuring your team’s workflow to support this kind of detailed analysis, see our SIC Team Formation: How to Handle Roster Changes Before Global Station Registration Closes.
Frequently Asked Questions
How many scenarios should I include in my SIC report?
Typically, including one base case and one or two distinct downside or upside scenarios is sufficient. The focus should be on the quality of the reasoning behind the adjustments rather than the quantity of scenarios.
Does SIC require complex statistical modeling for scenarios?
No, complex Monte Carlo simulations are generally not required for student-level analysis. Simple sensitivity tables and logical adjustments to key financial ratios are usually adequate and clearer for judges to follow.
What if my downside scenario makes the stock look bad?
That is acceptable. The goal is to show risk awareness. If the downside is severe, explain your mitigation strategy or why you believe the probability of that scenario occurring is low despite its impact.