When you are asked to compare two companies in the Student Investment Challenge, the first instinct is often to rank them by whichever margin looks larger. A retail business shows 25 percent gross margin; a software company shows 80 percent. The software company must be the better business. That shortcut fails more often than it succeeds, because it treats margin percentages as if they were measured on the same scale. How to Analyse a Company’s Economic Moat for Your SIC Thesis (2026) covers the broader framework of competitive advantage; this article focuses on the specific reasoning failure and how to correct it before you write a single line of your investment thesis.
Why Margin Percentages Are Not Automatically Comparable
Margin is a ratio, not a cash figure. It tells you what proportion of each dollar of revenue remains after a specific category of cost. The problem is that different industries recognise costs at different stages. A retailer records cost of goods sold at the point of sale. A software company may capitalise development costs and amortise them over years. A logistics operator owns heavy assets that generate depreciation long before the income statement ever sees a margin. If you compare the resulting percentages without adjusting for these structural differences, you are comparing accounting artefacts, not economic reality.
The skill that distinguishes a strong SIC thesis is the ability to reconstruct a like-for-like margin before declaring one business superior. This article walks through two teaching illustrations. The first shows a clean normalisation. The second shows where the shortcut fails. By the end, you should be able to diagnose when a margin comparison is misleading and what adjustment is required.
Case One: Adjusting Operating Leverage in Two Retailers
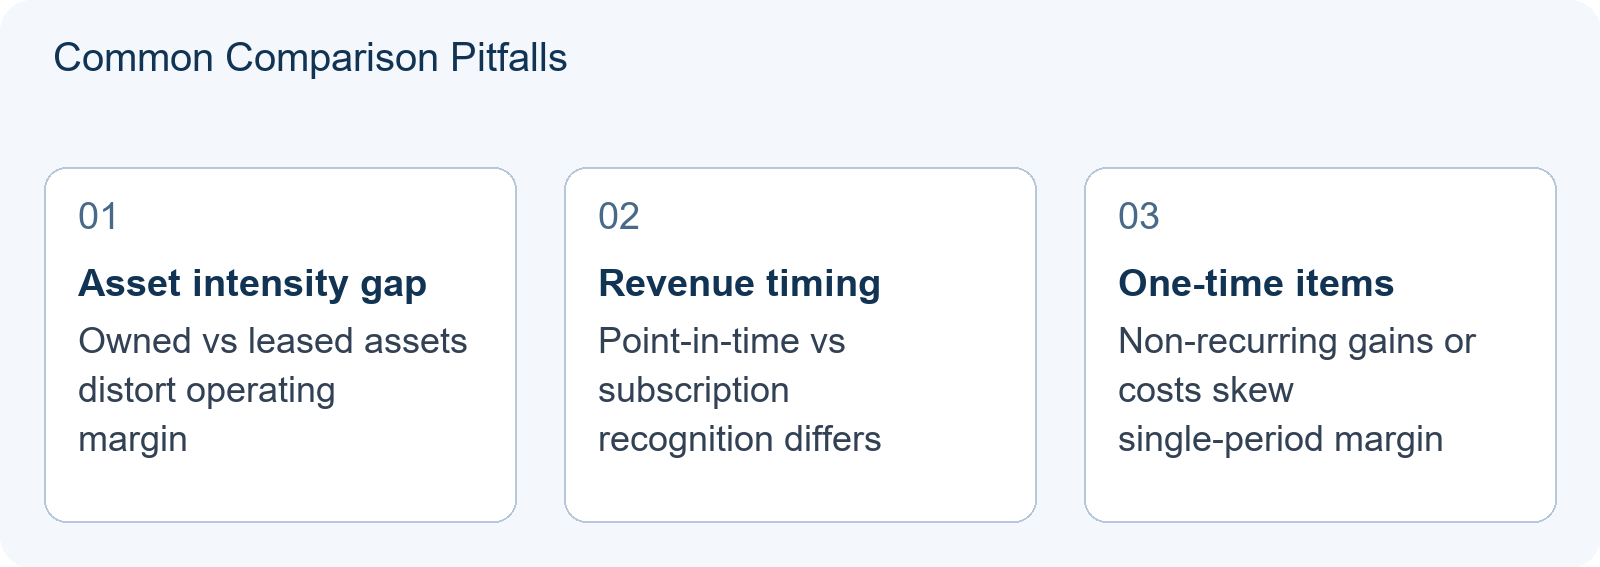
Imagine two hypothetical retailers, Alpha and Beta. Alpha reports a 12 percent operating margin. Beta reports 8 percent. At face value, Alpha wins. But Alpha leases all its stores on short-term contracts, so its operating expenses include variable rent that rises with revenue. Beta owns 60 percent of its store properties, so its operating expenses include heavy depreciation that does not vary with sales.
To normalise, you would add back Beta’s depreciation to operating profit and subtract an estimate of market rent for the owned properties. Suppose Beta’s depreciation is 4 percent of revenue and market rent would be 3 percent. Beta’s adjusted operating margin becomes 8 percent plus 4 percent minus 3 percent, which is 9 percent. Alpha’s 12 percent margin still leads, but the gap between Alpha and Beta has narrowed. On a raw basis, the gap was four percentage points. After adjustment, the gap is three percentage points. The ranking has not changed, yet the investment conclusion has shifted. Beta is less disadvantaged than the raw figure suggested, and its balance-sheet ownership of property may now look like a source of hidden asset value rather than a drag on margins.
This is the first key habit: always ask whether the cost structure behind the margin is structurally comparable before using the percentage as a ranking tool.
Case Two: Where the Shortcut Fails
Now consider two hypothetical technology businesses, Gamma and Delta. Gamma reports a 75 percent gross margin. Delta reports 45 percent. A quick ranking would favour Gamma. But Gamma is a hardware-software bundle: it recognises revenue upfront and defers support costs. Delta is pure subscription software: it recognises revenue over the contract life and expenses customer success immediately. The accounting timing is opposite.
If you normalise both to an annualised recurring-revenue basis and match costs to the period in which they generate value, Gamma’s true margin drops to 50 percent while Delta’s rises to 55 percent. The ranking flips. The original 30-point gap was an illusion created by revenue-recognition policy, not by business quality.
This is the second key habit: when business models differ in how they recognise revenue and costs, margin normalisation is not optional. It is the difference between a defensible thesis and a rejected one.
Diagnostic Table: When to Trust the Raw Margin
| Situation | Raw margin usable? | Adjustment needed |
|---|---|---|
| Same industry, similar asset intensity | Often yes | Minor lease vs. own adjustments |
| Different industries with unlike cost structures | No | Rebuild to common cost basis |
| Different revenue recognition policies | No | Annualise or match to value delivery |
| One-time costs or gains distorting the period | No | Restate on adjusted basis |
| Capital intensity differs materially | No | Compare return on capital, not margin alone |
Use this table as a quick reference during your initial company screen. If you tick “No” in the middle column, the margin comparison is not yet ready for your thesis.
A Repeatable Practice Sequence
Here is a suggested sequence you can apply to any pair of companies you are evaluating for SIC. It is framed as a teaching illustration, not an official marking rubric.
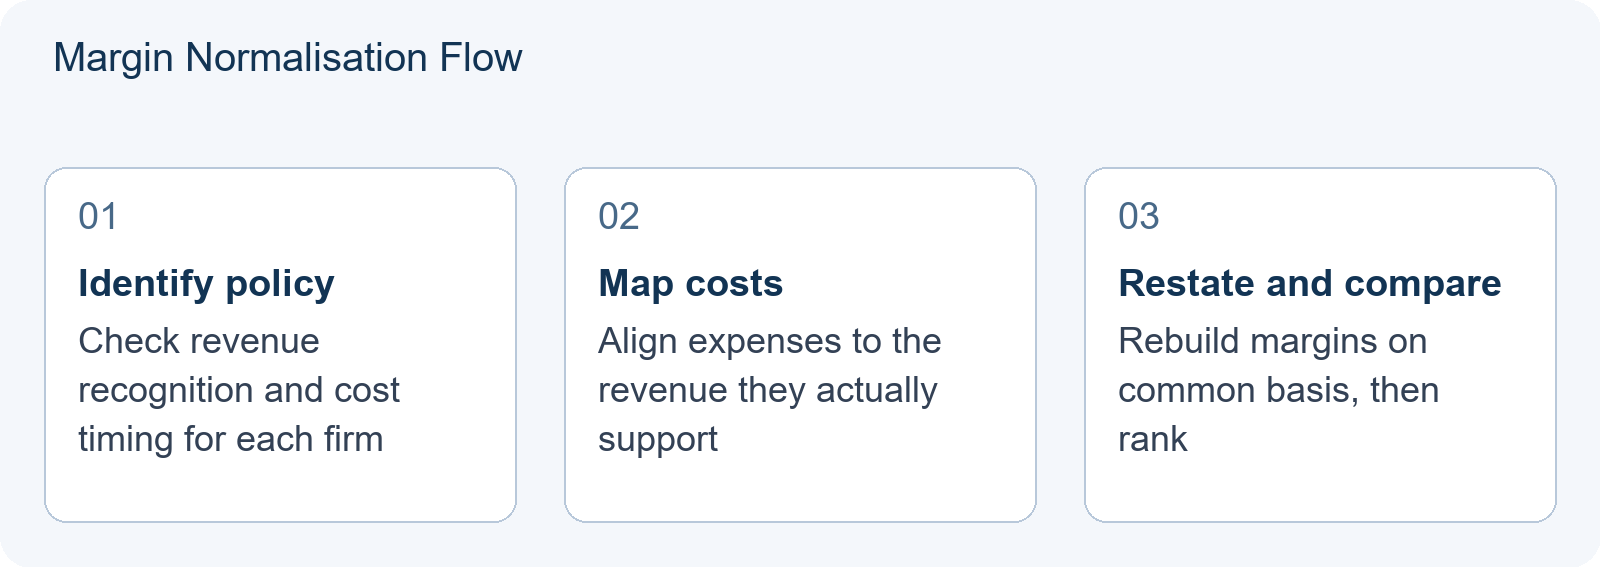
- Step one: Identify the revenue-recognition policy for each company. Note whether revenue is recognised at a point in time or over time.
- Step two: Map the major cost categories to the revenue they support. Flag any costs that are capitalised, deferred, or non-cash.
- Step three: Restate both companies on the same basis. This may mean adding back depreciation, subtracting estimated market rents, or annualising subscription revenue.
- Step four: Compare the normalised margins and ask whether the ranking has changed. Document any flip in your working notes.
- Step five: Before writing the thesis, sanity-check against return on invested capital. A margin advantage that does not translate into capital efficiency is often weaker than it appears.
For additional guidance on deciding whether your thesis should defend a company, a sector, or a macro view, see Company, Sector, or Macro: Choosing What Your SIC Thesis Actually Defends (2026). To understand how capital allocation decisions affect the margins you are comparing, refer to Capital Allocation: What a Company Does With Its Cash, and Why It Belongs in Your SIC Thesis (2026).
What You Should Be Able to Demonstrate
After working through these teaching illustrations, a prepared SIC participant should be able to take any two companies from the same or different industries, identify the structural reason their margins are not directly comparable, apply the appropriate normalisation, and state whether the ranking holds or reverses. This skill is not about calculating a precise adjusted figure to two decimal places. It is about showing that you understand margin as an accounting output that must be interrogated before it can be trusted.
The next time you open a set of financial statements for your SIC thesis, pause at the margin line. Ask what is buried inside that percentage. The answer often changes the entire investment case.
Frequently Asked Questions
Do I need to normalise margins if both companies are in the same industry?
Often only minor adjustments are needed, but always check for differences in asset ownership, lease structure, or revenue recognition that could still distort the comparison.
Can I rely on adjusted EBITDA margins from company filings?
Company-adjusted figures may exclude different items. Build your own normalisation from the financial statements to ensure the same basis across both firms.
How much detail should I include in my SIC thesis margin analysis?
Show the key adjustment and its directional effect on the ranking. A clear, concise normalisation with a stated assumption is stronger than an exhaustive but unexplained table.