Direct Answer: Treat Every ESG Claim as a Research Question
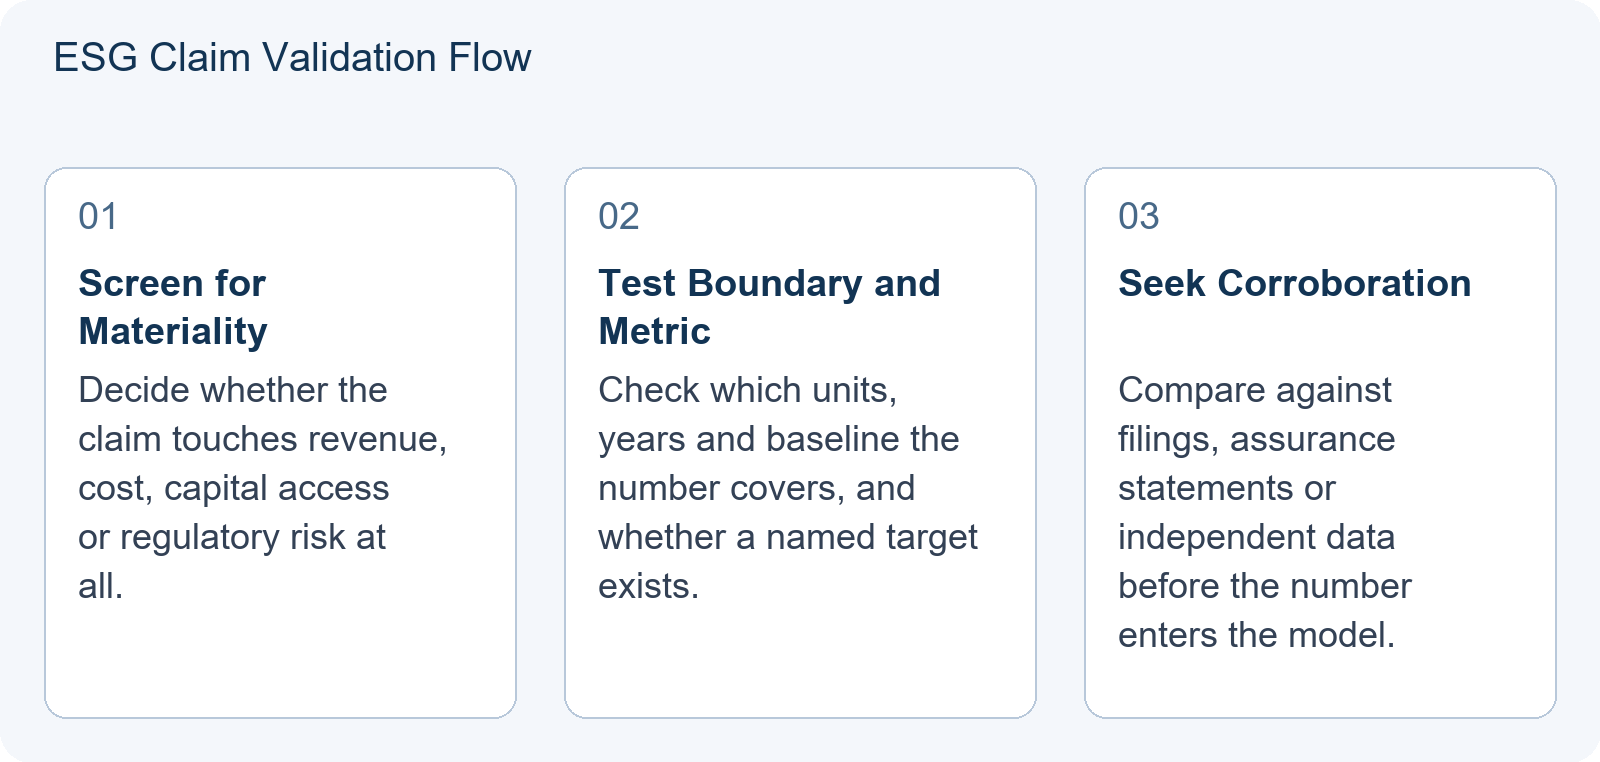
The SIC S16 AI+ESG Investing theme asks student analysts to connect artificial intelligence with environmental, social and governance evaluation. In practice, the hardest part is not finding ESG statements — annual reports and sustainability pages are full of them. The hard part is deciding which statements deserve space in a 15–30 page strategy report and which are decoration. A claim earns its place only when it passes four tests: materiality (does it touch revenue, cost, capital or regulatory risk?), boundary (which subsidiaries, geographies and years does it cover?), measurement (is there a baseline, a metric and a target date?), and corroboration (does anything outside the company’s own narrative support it?).
Run that four-part test on every sustainability sentence you are tempted to quote. Claims that pass can be modelled, argued and defended at the question stage. Claims that fail do not have to be deleted, but they should be labelled as unverified management language rather than presented as fact. That single habit is what separates an AI+ESG thesis that reads like research from one that reads like a slogan.
What the S16 Source Material Actually Says
Two Hanlin Curriculum WeChat articles set out the S16 theme. The first, published 17 September 2026, announces the new season, states the theme as “AI+ESG Investing,” and encourages participants to explore how AI can support environmental, social and governance investment evaluation. The second, published 19 October 2026, repeats the theme and adds that the seasonal background and research standards will be organised around it. That article describes AI as enabling more efficient ESG data analysis, risk assessment and investment decisions.
Read carefully, those notes say two things and imply a third. They say the theme is AI+ESG Investing, and they say the framing material will be built around it. They do not say that AI output is authoritative, that any particular ESG metric is required, or that a company must be accused of anything. The implication for a team is simply that the theme rewards analysts who can combine tooling with judgement. Any further rule — a required number of ESG metrics, a mandated data source, a scoring weight — would need current official documentation, and none of that appears in these notes.
For calendar context, the same 19 October 2026 article lists the S16 registration window as 11 September to 29 November 2026, with the preliminary stage running October–December 2026. Teams reading this in late October 2026 are therefore inside the research window rather than at the start of it, which argues for deciding quickly which claims are worth chasing.
The Greenwashing Diagnostic Table
Use a table like the one below for each company in your portfolio. Fill it in before writing prose; the empty cells are usually the interesting ones.
| Diagnostic Dimension | Question to Ask | Red-Flag Signal | What Strong Disclosure Looks Like |
|---|---|---|---|
| Materiality | Does this issue affect revenue, cost, capital access or regulatory exposure? | Office-level initiatives highlighted while the core product’s emissions or labour exposure goes unaddressed. | A quantified link to a financial line item, or an explicit argument for why the issue is immaterial to this business. |
| Boundary | Which entities, geographies and time periods sit inside the number? | “We aim to” language with no subsidiary list; baselines quietly reset after an acquisition. | A stated perimeter, a comparable prior-year baseline, and disclosure of acquisitions or divestments in the period. |
| Measurement | Is there a named metric, a base year and a target date? | Percentage improvements with no base, or targets with no year attached. | Named metric, base year, target year and a stated methodology or reporting standard. |
| Corroboration | Can anything outside the company confirm it? | Self-reported figures only, with no assurance and no regulator or independent dataset to compare against. | Third-party assurance, figures that match regulatory filings, or independent datasets that broadly agree. |
Worked Teaching Illustration: The Baseline That Moved (Hypothetical)
This is a constructed teaching illustration built for this article. It is not a real company case and not a contest item.
Suppose a manufacturing company reports that Scope 1 and Scope 2 greenhouse gas emissions fell 15% over three years. The number is disclosed and reviewed. On that basis a student writes: “The company is decarbonising, so its regulatory risk is falling, so the discount rate should be lower.”
Now suppose the analyst checks the boundary. Two years ago the company acquired a plant with high emissions. The disclosed 15% reduction compares the current group against a base year that excludes that plant. Absolute group emissions may therefore have risen while the headline percentage still fell. Nothing in the disclosure is a lie; the perimeter simply moved and the comparison is not like-for-like.
What should the student do? Three options, all defensible:
- Normalise. Recompute emissions per unit of production, or per unit of revenue, using figures from the financial statements, and see whether intensity actually improved.
- Re-baseline. State the exclusion openly, rebuild the base year to include the acquired plant where data allows, and present both the reported and the adjusted number.
- Downgrade the claim. If the data needed for either adjustment is unavailable, treat the 15% figure as unverified narrative and remove it from the valuation argument, keeping it only as a descriptive sentence.
The judged skill here is not detecting fraud. It is noticing that a metric’s boundary is a modelling choice, and showing the reader that you noticed. Note also the difference between intensity and absolute emissions: a company can reduce emissions per unit produced while total emissions rise because it produces more. Both numbers can be true, and which one matters depends on what you are modelling. Regulatory cost is often tied to absolute totals or to a cap; operating efficiency is usually tied to intensity. Choosing the wrong denominator is a modelling error, not a disclosure failure — and it is the kind of error that a short boundary check prevents.
How AI Genuinely Helps in an AI+ESG Thesis
AI is useful in this workflow for four specific jobs. Naming them precisely matters, because teams often overstate or underuse the tool.
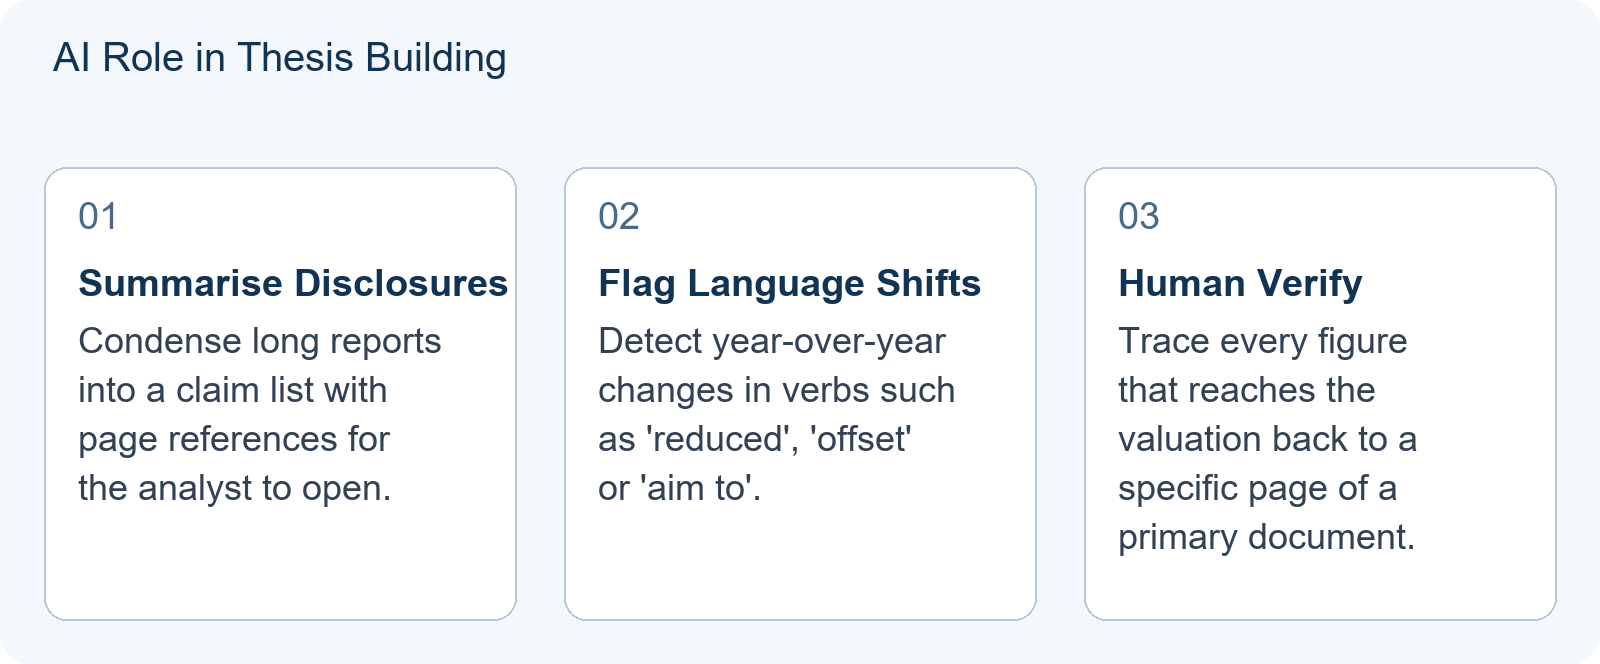
- Summarising long disclosures. A 120-page sustainability report can be condensed into a structured list of claims, each with a page reference. That saves reading time; it does not remove the need to open the pages that matter.
- Tracking language drift. Year-over-year comparison of a company’s own wording is a legitimate use. If one year says “we reduced” and the next says “we offset” or “we aim to reduce”, the change in verb is a signal worth following into the footnotes.
- Flagging omissions. Asking a model to list the metrics normally disclosed by peers in the same sector, then checking which are missing from your target’s report, generates hypotheses quickly and cheaply.
- Generating counter-hypotheses. Prompting for plausible reasons a reported metric could mislead — perimeter changes, currency effects, outsourcing, definitional shifts — produces a checklist to test rather than a conclusion to accept.
In all four cases the AI output is a set of candidate questions. The answers still come from primary documents, and the team that keeps that distinction sharp will write a stronger report than the team that treats generated text as evidence.
Where AI Cannot Help
Three limits matter in a competition setting.
First, a model cannot verify an external fact on its own. It reproduces patterns from training data, which may be stale, incomplete or simply wrong about a specific company’s disclosure perimeter. Second, it cannot read the primary source for you: the assurance statement, the segment footnote, the regulatory filing. If the number matters, someone on the team has to open the document. Third, it cannot resolve definitional ambiguity. Two companies can both report “Scope 3 emissions” while including very different categories, and no summarisation step reconciles that for you.
The practical division of labour is therefore simple: AI compresses and challenges; the human analyst verifies and decides. If a team cannot trace every ESG number in its report back to a specific page of a specific document, that number should not be driving a valuation output. This is a working standard, not a rule quoted from any organiser document — treat it as the standard your own report should be able to survive.
A Practical Decision Aid: Does the Claim Change the Thesis?
Before spending a week on an ESG thread, ask one question: if this claim turned out to be false or misleading, would my recommendation change?
If yes, the claim is material to your argument and deserves explicit treatment — a paragraph in the report, a sensitivity in the model, or both. If no, it is colour, and it belongs in a short qualitative note at most. This test is a time-management tool as much as an analytical one. SIC teams typically have limited research hours alongside schoolwork, and the temptation with a theme like SIC S16 AI+ESG Investing is to chase every sustainability disclosure in the sector. The decision aid keeps effort on the claims that can move a number.
Two refinements are worth adding. First, “changes the recommendation” includes changes to risk, not just to value: a claim that alters your view of regulatory exposure or litigation probability is material even if it leaves your price target intact. Second, materiality is company-specific. Water intensity can be central for a beverage producer and marginal for a software company, so sector context belongs in the same sentence as the metric.
Reading This Into Your Report and Your Preparation
In the written report, show the audit trail rather than the conclusion. A short appendix table listing each ESG claim, its source page, its boundary, and whether it survived testing is quick to produce and easy for a judge to check. At the question stage, the same table lets you answer “why do you believe that number?” without improvising.
Teams building the analytical side of this can pair the method here with the site’s guide to SIC AI+ESG Thesis: How to Use AI as a Verifiable Screening Tool, which covers the tool-facing half of the workflow. If your difficulty is deciding which sustainability issues count at all, the article on ESG in a SIC Thesis: How to Treat Materiality as a Scored Input, Not a Checkbox (2026) attacks the same problem from the materiality side. And because the point of all this is to change an investment view, the piece on SIC Investment Thesis: Identify the Evidence That Would Change Your Mind is the natural companion for the decision stage.
For families planning support around the S16 season, the useful question is not which course exists but which part of the workflow is weakest. Some students need help structuring a research programme; others need help evaluating sources; others need help converting findings into a defensible thesis. Hanlin’s own published S16 material describes preparation courses covering financial analysis, valuation and Excel modelling, alongside team-formation assistance for the strategy division; those offerings appear in the 19 October 2026 article cited above, and the details should be confirmed directly with the provider rather than inferred from a summary. The method in this article stands on its own regardless of what support a team chooses: read the perimeter, test the metric, name the counter-case, and keep only the claims that move a number.
General event background is available at Event background.
Frequently Asked Questions
Does SIC S16 require me to prove a company is greenwashing?
No. Neither the S16 source notes nor this method asks you to accuse a company of anything. The method asks you to show whether a given claim is material, bounded, measured and corroborated, and to state how your answer affects the thesis. Calling an unverified claim unverified narrative is a research judgement, not an allegation, and it is a stronger report position than repeating the claim or overstating it.
Can I use AI to calculate ESG scores directly?
Use AI to compress disclosures, compare language across years and generate candidate questions. Do not present a model-generated ESG score as if it were verified data. Every figure that reaches your valuation should be traceable to a primary document, and your report should describe how you checked it — that description is itself part of the analytical work the theme rewards.
How do I decide whether an ESG issue is material for my company?
Ask whether the issue affects revenue, cost, capital access or regulatory exposure for that specific business and sector. If the answer is yes, it belongs in the model or in a sensitivity. If the answer is no, mention it briefly and move on. S16 source material frames the season around AI+ESG Investing, and depth on a small number of material issues generally reads better than a shallow sweep across many immaterial ones — that is a coaching judgement about report quality, not a published rubric weight.