When preparing for the Student Investment Challenge (SIC), specifically the Senior Division strategy report, students often struggle with explaining financial performance. A common pitfall is attributing revenue changes solely to “better sales” or “higher prices” without isolating the underlying drivers. This article focuses on the specific analytical skill of separating SIC Revenue Drivers: Price, Volume, and Product Mix.
The Core Analytical Challenge
In a competition report, judges look for rigorous attribution. If total revenue increases, you must demonstrate why. Was it because you sold more units? Did you raise prices? Or did you shift focus to higher-margin products? Failing to decompose these factors leads to vague conclusions that weaken your investment thesis. This distinction is critical for the SIC U-FEB Quiz: What It Tests and How to Prepare Without Wasting Report-Writing Time, where precise economic reasoning is tested.
The challenge intensifies when companies operate across multiple product lines or geographic segments. A consolidated revenue figure masks the true dynamics of the business. For example, a 12% revenue increase might feel impressive until you discover that 10 percentage points came from a one-time price hike in a declining market, while volume actually fell. Without decomposition, your report celebrates growth while missing the warning signal of eroding market position.
Teaching Illustration 1: The Successful Decomposition
The following is an original teaching illustration, not an official past-paper question or marking criteria.
Imagine a student team analyzing a fictional consumer electronics company. Total revenue grew by 10% year-over-year. A naive analysis might state: “Revenue increased due to strong demand.” A rigorous SIC report would break this down:
- Volume Effect: Units sold increased by 5%.
- Price Effect: Average selling price (ASP) increased by 3%.
- Mix Effect: Sales shifted toward premium models, contributing an additional 2% growth.
By quantifying each driver, the team can argue that their investment thesis relies on the company’s ability to maintain premium pricing power (Price/Mix) rather than just market expansion (Volume). This level of detail supports the analytical depth expected in high-scoring reports.
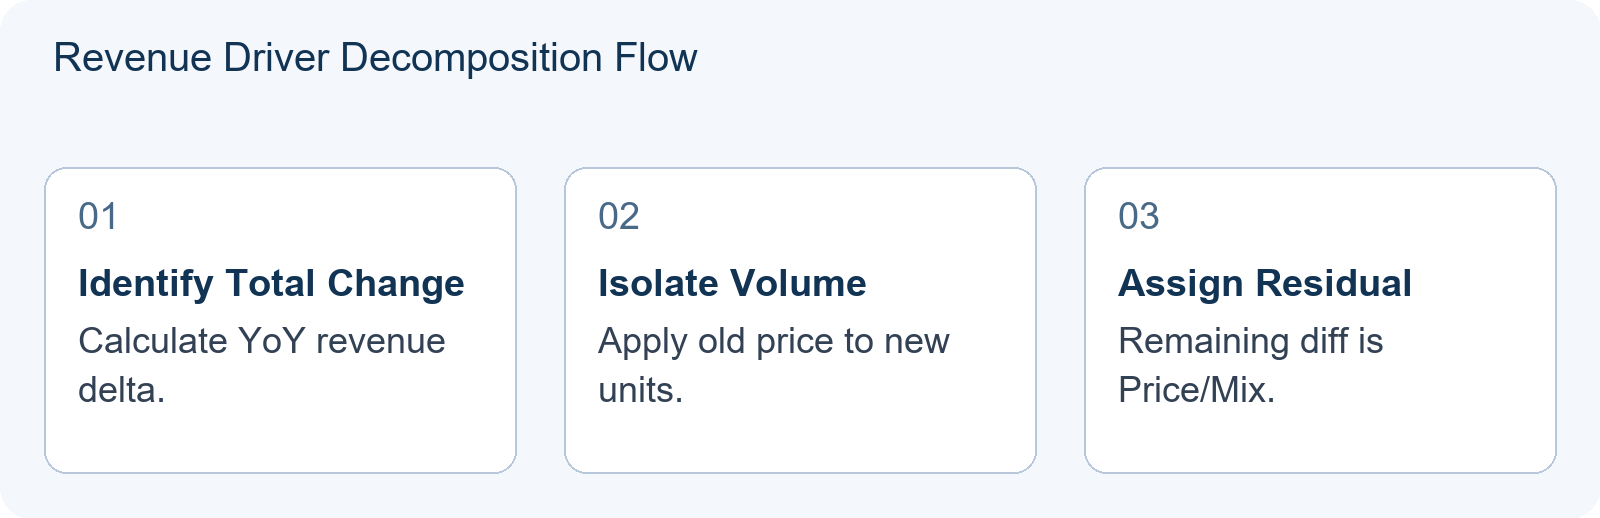
The practical implementation requires careful data handling. The team would calculate the volume effect by applying the prior-year price to current-year units, then compare to prior revenue. The price effect uses current-year volume with the price change. The mix effect captures the interaction and segment shifts that pure price and volume changes cannot explain. This residual method, while imperfect, provides sufficient rigor for competition purposes when clearly disclosed.
Teaching Illustration 2: The Common Mistake
The following is an original teaching illustration, not an official past-paper question or marking criteria.
Consider a second scenario involving a retail chain. Revenue rose by 8%, but profit margins declined. The team attributed the revenue growth entirely to “new store openings” (Volume). However, they failed to account for a significant discounting campaign that lowered ASP (Price) and a shift away from high-margin accessories (Mix).
This oversight led to a flawed conclusion: “Growth is sustainable.” In reality, the growth was driven by low-quality volume at the expense of profitability. Reports lacking this causal clarity risk appearing superficial to judges. To strengthen your exhibits, see Exhibits That Carry the Argument: Designing Charts and Tables for a SIC Strategy Report.
The diagnostic failure here runs deeper than a single miscalculation. By not interrogating the quality of revenue, the team missed an opportunity to demonstrate sophisticated risk awareness. Judges frequently reward teams that identify precisely this kind of tension: top-line growth that masks underlying profitability pressure. The ability to spot and articulate this trade-off separates analytical reports from merely descriptive ones.
Diagnostic Framework for Revenue Attribution
To ensure your report correctly identifies SIC Revenue Drivers, use the following diagnostic table during your analysis phase:
| Driver | Question to Ask | Data Required | Common Pitfall |
|---|---|---|---|
| Volume | Did we sell more units? | Unit sales data (YoY) | Confusing market share growth with absolute volume growth. |
| Price | Did we charge more per unit? | Average Selling Price (ASP) | Ignoring inflation-adjusted price changes. |
| Mix | Did we sell different products? | Product category breakdowns | Failing to weight categories by margin contribution. |
Apply this framework iteratively. First-pass calculations often reveal data gaps that force you to refine your assumptions. Document these refinements transparently; judges prefer honest limitations over concealed uncertainty. When segment data is incomplete, state your interpolation method explicitly rather than presenting figures as more precise than the underlying data supports.
Targeted Practice Sequence
Students should practice this decomposition using public 10-K filings before applying it to their SIC project. Start with simple single-product companies, then move to multi-segment firms. This builds the analytical foundation needed for the research-intensive phases of the competition. For scheduling your preparation alongside other commitments, see The Wharton 2026-27 Investment Competition Calendar, Decoded for SIC Analysts (Registration Closes 11 September).
The progression from simple to complex cases mirrors the skill development judges expect. Early practice with homogeneous product companies establishes the mechanical fluency of calculating price and volume variances. Advancing to conglomerates with disparate business units then tests your ability to handle mix effects across fundamentally different operations. This staged approach prevents the overwhelm that comes from attempting full complexity prematurely.
Step-by-Step Exercise
- Select a company with three distinct product lines.
- Calculate total revenue change.
- Isolate volume change by holding price constant.
- Isolate price change by holding volume constant.
- Attribute the residual to mix shifts.
Mastering this technique ensures your strategy report demonstrates the analytical depth required for recognition in the Senior Division. It transforms generic commentary into actionable investment insights.
Beyond the mechanical steps, develop the habit of asking “so what?” after each decomposition. A 7% price effect and 3% volume effect tell one story for a luxury goods company with pricing power; the same split suggests vulnerability for a commodity producer facing demand destruction. The numbers gain meaning only when connected to competitive positioning and industry dynamics. This interpretive layer elevates your report from calculation exercise to investment analysis.
For teams preparing reports that span multiple analytical sections, consistency in methodology matters. If you decompose revenue drivers in the performance section, apply the same rigor to cost drivers in the operational analysis. Judges notice when analytical standards fluctuate across sections, and they interpret such inconsistency as incomplete mastery rather than selective emphasis.
Finally, remember that attribution is not merely backward-looking. The decomposition you perform on historical data sets up forward-looking scenarios that test your thesis under different assumptions. If your investment case depends on continued mix improvement, explicitly model what happens if mix stabilizes or reverses. This sensitivity analysis demonstrates the scenario thinking that distinguishes robust reports from fragile ones.
Frequently Asked Questions
Do I need advanced statistical tools to separate revenue drivers?
No. Basic algebraic decomposition using unit sales and average selling price is sufficient for most SIC reports. Complex regression is rarely required unless dealing with highly volatile markets.
How does product mix affect profitability differently than revenue?
Revenue measures top-line growth, while mix affects margins. Selling more low-margin items boosts revenue but may hurt profits. Your report must distinguish between these impacts.
Can I use hypothetical data if real company data is unavailable?
For practice, yes. But in your actual SIC submission, you must use real, verifiable financial data from official filings like 10-Ks to maintain academic integrity.