For students preparing for the Student Investment Challenge (SIC), particularly those in the Senior Division writing investment strategy reports, a critical analytical skill is reconciling reported profit with actual cash generation. Many novice analysts assume that high Net Income equates to strong financial health. However, accounting rules allow for significant divergence between profit and cash flow due to non-cash items and working capital changes. This article explains the mechanism of this reconciliation, provides checked worked teaching illustrations, contrasts cases where superficial analysis fails, and offers practical steps for integrating this analysis into your SIC thesis.
The Mechanism: Why Profit Does Not Equal Cash
Under accrual accounting, revenue is recognized when earned, not necessarily when cash is received. Similarly, expenses are recorded when incurred, not when paid. The Statement of Cash Flows bridges this gap by adjusting Net Income for non-cash charges and changes in working capital. For SIC participants, understanding this bridge is essential because judges look for evidence that you can distinguish between accounting profitability and liquidity dynamics. A company may report record profits while consuming cash if its inventory or receivables are growing faster than its payables.
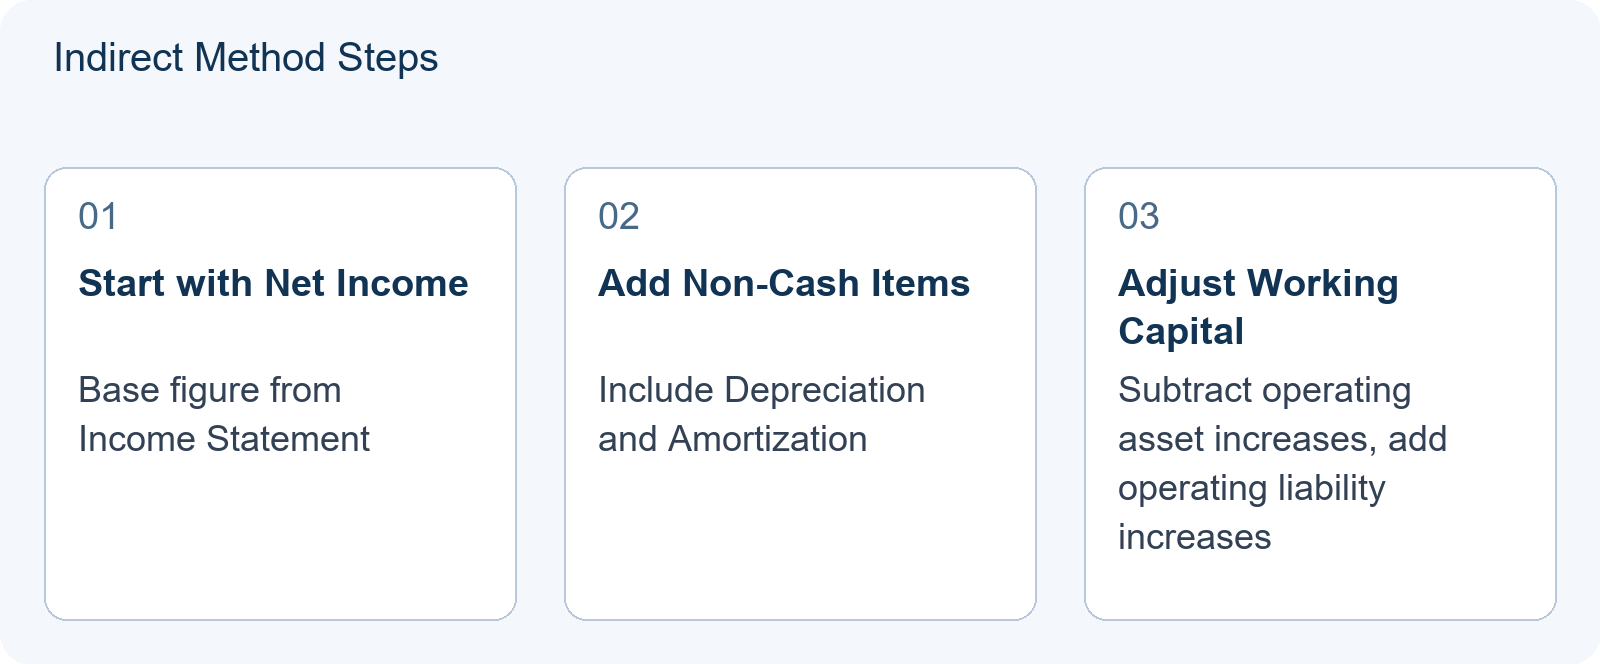
The indirect method, commonly used in US GAAP filings, starts with Net Income and adds back non-cash expenses like depreciation and amortization. It then adjusts for changes in current operating assets and liabilities. An increase in accounts receivable reduces cash flow from operations because sales were made but cash was not collected. Conversely, an increase in accounts payable increases cash flow because the company delayed paying suppliers. Mastering these adjustments allows you to critique management’s narrative about performance. Note that working capital here refers to operating items—receivables, inventory, and payables—not all debt or assets. Acquisitions, foreign exchange translation, and noncash balance sheet movements also require reconciliation in practice; the simplified teaching illustrations below assume none of these complicating factors.
Worked Teaching Illustration: Company Alpha
Note: This is a hypothetical teaching illustration created for educational purposes. It is not an actual contest problem or official scoring guidance.
Consider “Company Alpha,” which reports the following figures for the fiscal year:
- Net Income: $10 million
- Depreciation & Amortization: $4 million
- Increase in Accounts Receivable: $3 million
- Increase in Inventory: $2 million
- Increase in Accounts Payable: $1 million
To calculate Operating Cash Flow (OCF) using the indirect method, we start with Net Income and adjust as follows:
- Add Depreciation & Amortization: $10m + $4m = $14m
- Subtract Increase in Accounts Receivable: $14m − $3m = $11m
- Subtract Increase in Inventory: $11m − $2m = $9m
- Add Increase in Accounts Payable: $9m + $1m = $10m
The resulting OCF is $10 million. In this scenario, OCF equals Net Income, but this equality masks underlying dynamics. The company generated $14 million before working capital changes, yet consumed $4 million in net working capital ($3m AR + $2m Inventory − $1m AP). If a student simply looked at Net Income, they might miss that the company had to fund significant growth in receivables and inventory. In a SIC report, highlighting this working capital drag demonstrates deeper analysis than merely citing the bottom line.
Contrasting Case: Where Superficial Analysis Fails
Note: This is a hypothetical teaching illustration created for educational purposes. It is not an actual contest problem or official scoring guidance.
Now consider “Company Beta,” which also reports Net Income of $10 million. However, its balance sheet shows different trends:
- Depreciation & Amortization: $4 million
- Increase in Accounts Receivable: $8 million
- Increase in Inventory: $5 million
- Increase in Accounts Payable: $2 million
Calculating OCF for Company Beta:
- Add D&A: $10m + $4m = $14m
- Subtract AR Increase: $14m − $8m = $6m
- Subtract Inventory Increase: $6m − $5m = $1m
- Add AP Increase: $1m + $2m = $3m
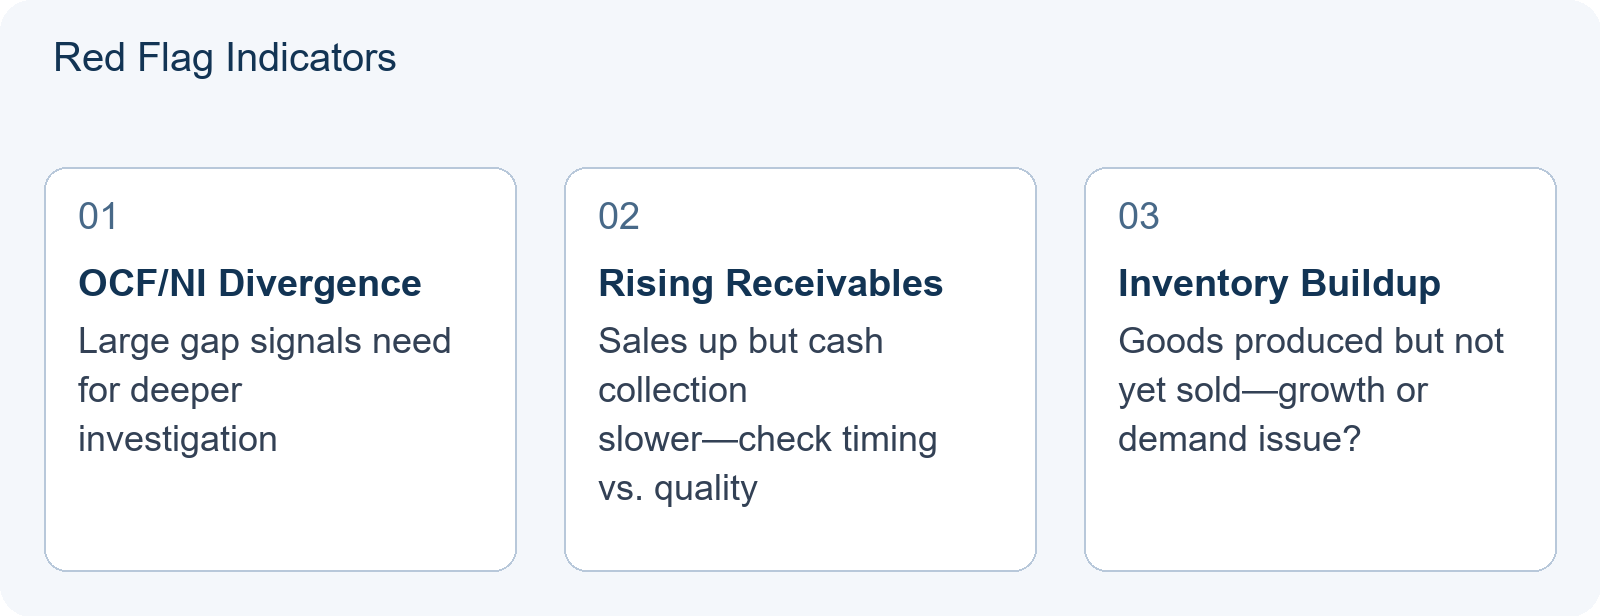
Company Beta’s OCF is $3 million, despite reporting $10 million in Net Income. Since both companies report identical Net Income, ranking them by profit alone is impossible—yet their cash generation profiles differ dramatically. Beta’s lower OCF does not automatically mean default, unsold inventory, or liquidity crisis; context such as growth phase, seasonality, collection timing, payment terms, cash reserves, and liability structure all matter. However, Beta’s receivables are ballooning, suggesting customers are paying more slowly, or the company is extending aggressive credit terms. Inventory buildup may indicate products are not selling as fast as produced, though it could also reflect deliberate stocking ahead of a product launch. If a SIC team recommends investing in Beta without noting this cash flow disconnect, their thesis lacks analytical depth. Evaluators expect recognition that Beta’s profit is less cash-backed than Alpha’s, and that further investigation into the reasons is warranted.
Diagnostic Application for Your Report
When analyzing a target company for your SIC strategy report, perform this diagnostic check. First, locate the Net Income figure from the Income Statement. Second, find the Operating Cash Flow figure from the Cash Flow Statement. Calculate the ratio: OCF / Net Income. This ratio can highlight potential concerns, but it is not a universal health indicator. With zero or negative earnings, the ratio becomes mathematically distorted or meaningless. Even with positive earnings, a ratio above 1.0 may simply reflect favorable timing or industry structure, while a ratio below 1.0 may be justified by growth investments or seasonal patterns.
If the ratio departs significantly from 1.0 in either direction, investigate why. Is it due to one-time non-cash gains inflating Net Income? Is it due to working capital changes that are temporary or structural? What is the company’s cash position and debt maturity profile? Write a paragraph in your report explicitly addressing material divergences. For example: “While Company X reported a 15% increase in Net Income, its Operating Cash Flow declined by 5%. This divergence is driven by a 20-day increase in Days Sales Outstanding, indicating potential collection timing changes. We view this as a factor requiring monitoring rather than automatic disqualification, and we have adjusted our liquidity assumptions accordingly.” This type of commentary shows evaluators that you understand the mechanics of financial statements beyond basic ratios.
Implications for Next Learning Tasks
Understanding this reconciliation prepares you for more advanced valuation techniques. When building Discounted Cash Flow (DCF) models, you must forecast Free Cash Flow, not Net Income. Since Free Cash Flow is derived from Operating Cash Flow minus Capital Expenditures, errors in estimating working capital changes directly impact your valuation output. Students who skip this foundational step often produce DCF models that are internally inconsistent with historical data.
Furthermore, this skill aids in comparing companies across sectors. Retailers often have negative working capital cycles (they sell goods before paying suppliers), leading to high OCF relative to Net Income. Software companies may have deferred revenue, where cash comes in before revenue is recognized, causing OCF to exceed Net Income initially. Recognizing these structural differences prevents apples-to-oranges comparisons in your SIC peer group analysis.
Preparation and Course Fit
If you are struggling to interpret these statements, structured guidance may help. According to source notes from the SIC English international site, Hanlin offers preparation support for SIC participants, including assistance with registration, placement testing, and team matching. For families seeking to understand the commitment required, note that the Senior Division involves rigorous research and report writing over several months. Early engagement with financial statement analysis can reduce stress during the competition window.
We recommend reviewing past entries to see how top teams integrated cash flow analysis into their narratives. While specific outcomes vary, the pattern of success consistently involves deep fundamental analysis rather than surface-level metrics. For additional preparation resources, see our articles on SIC Revenue Drivers: Separating Price, Volume and Product Mix in a Competition Report, SIC Company Comparisons: Normalising Margins Before Ranking Two Businesses, and SIC Scenario Analysis: Showing How a Valuation Changes When Assumptions Fail.
Conclusion
Reconciling profit with operating cash flow is not just an accounting exercise; it is a core competency for credible investment analysis. By mastering the indirect method and recognizing the implications of working capital changes, SIC participants can construct stronger, more defensible theses. Avoid the trap of equating high Net Income with high quality. Instead, dig into the cash flow statement to reveal the economic reality of the business, while remaining alert to the contextual factors—growth stage, seasonality, timing, and capital structure—that determine whether a cash flow pattern is truly concerning. This depth of analysis distinguishes competitive entries from average ones.
Interpreting the Gap: From Calculation to Thesis Argument
Note: This section builds directly on the hypothetical Company Alpha and Beta illustrations above. It is a teaching guide for interpretation, not official scoring criteria.
Calculating Operating Cash Flow (OCF) is only the first step. The critical skill for SIC Senior Division reports is interpreting why the gap between Net Income and OCF exists. A divergence is not inherently good or bad; it is a signal that requires context. Students often make the error of labeling any company with OCF < Net Income as “low quality.” This is analytically lazy. Instead, you must categorize the source of the divergence into three buckets: Structural, Cyclical, or One-Time.
1. Structural Divergence: The Business Model Reality
Some industries naturally have working capital cycles that decouple profit from cash. For example, subscription-based software companies often collect cash upfront (deferred revenue), causing OCF to exceed Net Income in growth phases. Conversely, heavy manufacturing firms may carry large inventory buffers to ensure production continuity, causing OCF to lag Net Income even when operations are healthy.
Diagnostic Task: Before judging Company Beta’s $3 million OCF against its $10 million Net Income, ask: Is this typical for its sector? Compare Beta’s OCF/Net Income ratio to its direct competitors. If all peers show similar ratios, the divergence is structural, not a red flag specific to Beta. In your report, state: “Beta’s lower cash conversion aligns with industry norms for capital-intensive manufacturers, suggesting the gap reflects business model mechanics rather than operational distress.”
2. Cyclical Divergence: Timing and Seasonality
Working capital changes are often temporary. A retailer might see a massive spike in inventory before the holiday season (reducing OCF) followed by a sharp drop in receivables after sales (increasing OCF). If you analyze a single quarter, the numbers may look distorted.
Diagnostic Task: Look at the trailing twelve months (TTM) or multi-year trends. Did Beta’s accounts receivable increase because customers are paying slower (a credit risk issue), or because sales volume surged (a growth success)? If sales grew 50% and AR grew 40%, the collection efficiency actually improved. If sales grew 5% and AR grew 40%, collection efficiency deteriorated. Always pair the balance sheet change with income statement growth rates. Write: “While Beta’s AR increased by $8m, total revenue rose by $10m, indicating that the cash flow drag is proportional to growth, not a sign of widening credit terms.”
3. One-Time Divergence: Non-Recurring Items
Accrual accounting can include non-cash gains or losses that distort Net Income but do not affect OCF. For instance, a company might record a gain from selling an asset (boosting Net Income) but the cash proceeds appear in Investing Activities, not Operating Activities. This creates a false impression of high profitability relative to operating cash generation.
Diagnostic Task: Scan the footnotes for “non-operating items” or “discontinued operations.” If Alpha’s Net Income includes a one-time tax benefit, adjust your analysis. Do not assume future years will replicate this profit level. In your thesis, explicitly exclude these items when forecasting future Free Cash Flow. State: “Alpha’s reported Net Income includes a $2m non-recurring gain; adjusting for this, the core operating profit is $8m, making the OCF/Adjusted Profit ratio more favorable than it initially appears.”
Actionable Next Step: The ‘Why’ Paragraph
To integrate this into your SIC strategy report, draft a dedicated paragraph titled “Cash Conversion Analysis.” Do not just list the numbers. Use the structure: Observation → Context → Implication.
- Observation: “Company X’s OCF was Y.”
- Context: “This divergence is driven primarily by [Inventory Buildup / Receivable Extension / Deferred Revenue], which is consistent with [Growth Phase / Seasonal Peak / Industry Norm].”
- Implication: “Therefore, we view the cash flow profile as [Healthy / Neutral / Concerning] because [Reason]. We monitor [Specific Metric] for signs of deterioration.”
This approach demonstrates to evaluators that you understand the mechanics of financial statements and can apply them critically to real-world scenarios, moving beyond superficial ratio chasing.
Frequently Asked Questions
Why does my calculated OCF differ from the company’s reported figure?
Check if you missed other non-cash items like stock-based compensation or impairments. Also ensure you correctly identified increases versus decreases in all working capital components. Acquisitions, foreign exchange effects, and noncash balance movements may also create reconciling items not shown in simplified illustrations.
Is a low OCF always bad for a SIC investment thesis?
Not always. High-growth companies may intentionally consume cash to capture market share. Seasonal patterns, collection timing, payment terms, and the company’s cash reserves and liability structure all matter. Compare against peers and industry norms rather than judging in isolation.
How much detail should I include in my SIC report?
Focus on material variances. You do not need to list every adjustment, but you must explain significant divergences between profit and cash flow that affect your valuation or risk assessment. A single well-explained paragraph often suffices.