A reader meets your exhibits before your paragraphs. They scan titles, glance at charts, stop at a table — and form a view of your rigour before reading a single argument in full. Well-built exhibits do not decorate the analysis; they carry it. The rules below turn figures from illustration into evidence.
Why exhibits are part of the assessment, not the packaging
The SIC publishes a four-axis rubric: thesis clarity, evidence quality, risk articulation and revision discipline. None of those axes is called “design”, which leads students to treat charts as the last hour’s work. That reading is backwards. Exhibits are the mechanism through which three of the four axes become visible:
- Evidence quality is demonstrated by a chart whose numbers are sourced, dated and reproducible — and undermined by one that is not.
- Risk articulation lives naturally in a scenario table, which forces you to state what happens if you are wrong instead of gesturing at it in prose.
- Thesis clarity is tested brutally by the exhibit title: if you cannot compress a figure’s point into one sentence, you have not yet decided what the figure is for.
It is worth noting how the sibling programme most of our readers also consider states the same principle explicitly: in the Wharton Global High School Investment Competition, judging rests on the rigour and presentation of the team’s strategy rather than portfolio return. The word “presentation” there is not about aesthetics. It means whether a reader can follow the reasoning. Our comparison of the SIC and the Wharton competition covers the structural differences; on this point the two converge completely.
Every exhibit needs a claim title, not a topic title
This is the highest-return change available to any student report, and it takes minutes. Most student exhibits are titled with their subject. Professional exhibits are titled with their conclusion.
| Topic title (what students write) | Claim title (what a reader can use) | What changed |
|---|---|---|
| Gross margin, 2021–2026 | Gross margin recovered to its 2021 level by the third quarter of 2026 | States the finding, so the chart proves something instead of showing something |
| Revenue by segment | Two thirds of revenue now comes from the segment growing slowest | Names the tension the thesis has to resolve |
| Peer comparison | The company trades below every peer on earnings, and above all of them on debt | Turns a table into an argument about why the discount exists |
| Scenario analysis | The thesis survives a 15% volume decline but not a 300 basis-point margin loss | Identifies which assumption actually carries the case |
| Share price history | The re-rating began before the earnings recovery, not after it | Makes a claim about sequence, which is what a catalyst argument needs |
The rule has a useful side effect: it kills weak exhibits. If you cannot write a one-sentence claim for a figure, that figure has no job. Cut it. A report with six exhibits that each make a point reads as far more rigorous than one with fourteen that each show a topic — and it is quicker to defend, because you can say what every picture is for.
Two constraints on claim titles. Keep them factual rather than promotional: “margins recovered to 2021 levels” is a claim, “margins are recovering impressively” is an opinion in a place where readers expect data. And make sure the chart actually shows what the title asserts. A title claiming a recovery, above a chart whose axis begins at a level that manufactures the shape, is the fastest way to lose a reader’s trust.
The anatomy of an exhibit that survives scrutiny
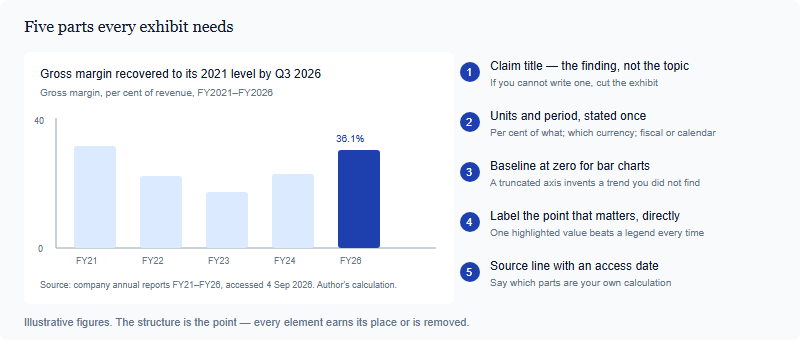
Component five deserves expanding, because it is where student work most often falls short of the standard it otherwise reaches. A source line is not a website name. It should let a reader reproduce the figure: which document, which period, when you accessed it, and what you did to the raw numbers. “Source: company annual reports FY21–FY26, accessed 4 September 2026; margins calculated by the author” is complete. “Source: internet” is not, and neither is a chart with no source line at all — which a careful reader treats as a chart with no source.
Where those numbers should come from in the first place is a separate discipline from how you label them, and one we cover elsewhere. The rule here is narrower: whatever you used, the exhibit must say so on its face, without the reader having to hunt through a bibliography.
Choosing the right form for the question
Chart choice is not a matter of taste. Each question type has a form that answers it cleanly and several that obscure it. The most common student error is reaching for the visually interesting option when a plain one would have communicated more.
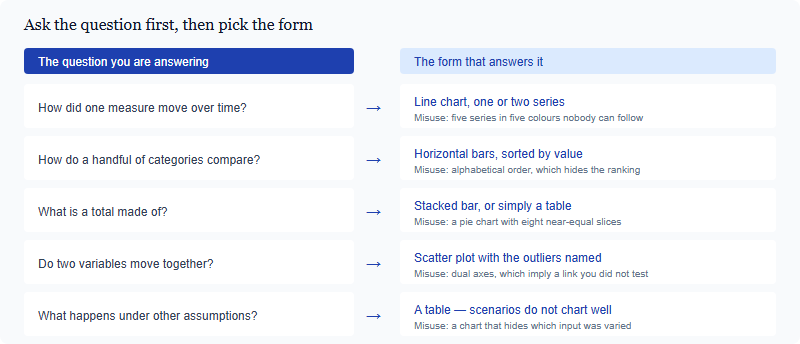
Two of those rows carry most of the damage in student work. Dual axes place two series with different units on one chart and let the reader infer a relationship from lines that happen to converge; by choosing the scales you can make almost any two series look related, which is exactly why experienced readers distrust the format. If you believe two variables move together, show a scatter plot and let the spread speak. Pie charts fail whenever slices are close in size, because human eyes compare angles badly. A sorted bar chart answers the same question and can be read in a second.
And do not overlook the last row. Scenario analysis — the place where risk articulation becomes concrete — almost always belongs in a table. A table lets you hold every other assumption fixed while one varies, which is the entire point of the exercise, and it makes the reader’s question “what did you change?” answerable at a glance.
Tables that argue rather than store
A table is not a place to put numbers you could not fit elsewhere. In a strategy report it is a comparison instrument, and a few design rules make the difference between one that persuades and one that is skipped.
- Put the comparison in columns and the items in rows. Readers scan down a column to compare; they lose their place scanning across a row.
- Sort by the thing that matters — the metric your thesis turns on — not alphabetically. Ordering is an argument.
- Cut precision to the level you can defend. A margin of 36.1% is a finding; 36.14285% is a spreadsheet artefact that tells the reader you have not thought about measurement error.
- Keep one unit per column and state it in the header, so no cell has to carry a symbol.
- Add a final column for your reading of the row. A short verdict — “cheapest, but the balance sheet explains why” — converts a data table into analysis.
- Cap the size. If a table needs more than about eight rows or six columns, it is two tables, or it is an appendix.
The last-column habit is the one worth adopting immediately. Most student tables end at the numbers and leave the interpretation to a paragraph three pages later. Putting a one-line reading beside each row forces you to have an opinion about every item you included — and rows you have no opinion about turn out not to belong in the table.
A pre-submission exhibit audit
Run this pass once, near the end, on every figure and table. It takes under an hour for a full report and catches the errors that are most expensive relative to how easy they are to fix.
| Check | Pass condition | Why it matters |
|---|---|---|
| Claim title | Every exhibit title states a finding in one sentence | Proves each figure has a purpose; exposes the ones that do not |
| Source line | Document, period, access date, and any calculation you performed | The first question a sceptical reader asks about any number |
| Units and currency | Stated once per exhibit; consistent across the report | Mixed currencies inside one comparison invalidate it silently |
| Axis integrity | Bar charts start at zero; any truncation is flagged in a note | A truncated axis reads as a distortion, whether or not it was intended |
| Referenced in the text | Every exhibit is named and discussed in a nearby paragraph | An unreferenced figure looks like padding |
| Legible in monochrome | Meaning survives greyscale printing and colour-blind viewing | You do not control how the document is read or printed |
| Consistent house style | One font family, one accent colour, one date format throughout | Inconsistency reads as carelessness and costs credibility cheaply |
| Numbers reconcile | Figures in exhibits match the figures in the prose | The most damaging error of all — and the most common after late edits |
That final check deserves its own pass. Late in a project you revise a paragraph, update a number, and forget that the same figure appears inside a chart built two weeks earlier. A reader who spots a mismatch between your text and your exhibit does not conclude that you made a clerical error — they conclude they cannot rely on either number, and that suspicion spreads across the whole document.
None of this is decoration, and none of it requires design software or artistic ability. It requires deciding what each figure is for, saying so in its title, and telling the reader where the numbers came from. That is the same discipline the rest of the report is built on, applied to the parts a reader looks at first. If you are mapping this against the criteria your work will be read under, our axis-by-axis breakdown of the SIC rubric shows where exhibit quality shows up in the scoring, and our overview of what the SIC is sets out the deliverables each stage expects. Report length and format requirements are set by the competition and change yearly — confirm the current specification on the official SIC site before you lay anything out.
Frequently asked questions
How many exhibits should a strategy report contain?
Enough that each carries a claim, and no more. Six purposeful exhibits read as more rigorous than fourteen decorative ones.
Is it acceptable to reuse a chart from a data provider?
Only with clear attribution, and check the source’s terms. Rebuilding it from the underlying numbers is usually better and always more defensible.
Do I need charting software?
No. A spreadsheet produces every form discussed here. Clarity and labelling matter far more than the tool used.
Where should exhibits sit in the document?
Beside the paragraph that discusses them. An exhibit banished to an appendix will not be read while your argument is being read.
Published by the SIC editorial desk, operated by Hanlin Education for China-based international-school students. Official rules are set by the competition and change yearly — confirm current details on the official SIC site. Errors reported to this desk are corrected within 7 working days.