Every number in a SIC report starts life in a spreadsheet. A workbook that separates inputs, calculations and outputs, records the source and date of every assumption, and shows a two-variable sensitivity table lets a reader reproduce your conclusion in minutes. One that buries typed figures inside formulas cannot be checked at all — and an unverifiable number is worth less to your argument than a smaller, traceable one.
The workbook is part of the argument, not scratch paper
Students tend to treat the model as private machinery and the report as the deliverable. That split causes most of the damage we see at draft stage. The written claim — “this business is worth more than the market is paying” — is only as strong as the chain from a filing, to a cell, to a sentence. Break the chain anywhere and a reader has to take the conclusion on trust, which is exactly what a research competition asks them not to do.
Three specific moments punish a messy workbook. First, mid-stage feedback: a mentor who cannot find the growth assumption spends their comment budget asking where it is instead of telling you whether it is sensible. Second, any review of your work: the fastest way to weaken it is to answer “I would have to check the model” about your own central assumption. Third, your week-eight self, who no longer remembers why week-two typed 6.0% into a cell and now has to either re-derive it or quietly keep it.
If you have not read how the rubric reads a report, do that before you build anything. Scoring rewards reasoning that is visible and evidence that is attributable, and a workbook is where both get manufactured. For the competition itself — the stages, the divisions, the deliverables — start with our guide to what the SIC is. Whether the model or an appendix is submitted alongside the report is set by the rules each season; confirm the current submission format on the official SIC site rather than assuming last year applies.
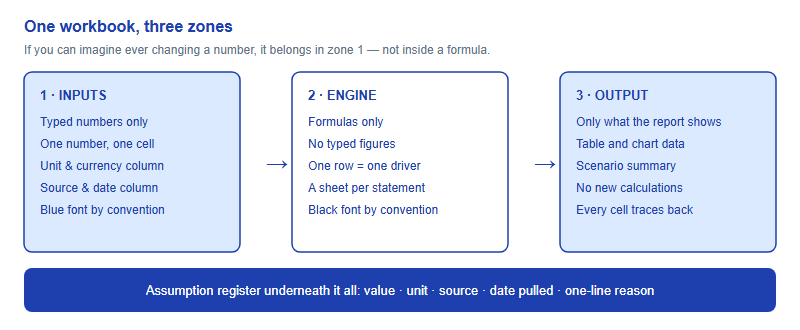
Three zones, and nothing typed twice
Professional models are boring in a specific way: they are organised so that a stranger can find any number in under ten seconds. Copy the structure.
- Zone 1 — Inputs. Every externally sourced figure, one per cell, never repeated. Adjacent columns hold the unit, the currency, the source and the date you pulled it. Nothing on this sheet contains a formula.
- Zone 2 — Engine. Formulas only. The single rule that fixes most student models: if you can imagine ever changing a number, it does not belong inside a formula. True constants (12 months, 365 days) are the only exceptions.
- Zone 3 — Output. Only the tables and chart data the report actually shows, plus a scenario summary. No new calculations happen here; every cell points back to zone 2.
Adopt the colour convention while you are at it: blue font for typed inputs, black for formulas, green for links to another sheet. It looks like decoration and functions like a smoke alarm — a black cell that should be blue is a hard-coded number hiding in plain sight.
Two habits matter disproportionately for China-based students working on cross-listed names. Label the currency at the top of every column, and state the units in a dedicated row: millions, thousands, or absolute. Mixing a revenue line in one currency with a share price in another is the most common silent error we see, and it never announces itself — the model runs, the number is simply wrong by a factor nobody catches until a reader checks the workbook.
The assumption register: value, unit, source, date, reason
An assumption register is a small table that sits beside your inputs and answers, for each driver, five questions a reader will have. It takes about twenty minutes to set up and it is the single highest-return piece of admin in the whole season, because it converts “I think growth is around six percent” into a defensible statement.
| Driver | Value used | Unit | Source | Date pulled | Reason, in one line |
|---|---|---|---|---|---|
| Revenue growth, year 1 | 6.0 | % year on year | Management guidance range, latest results release | Record the day you read it | Mid-point of the disclosed range |
| Revenue growth, years 2–5 | 4.0 | % year on year | Own estimate | — | Fades toward five-year historical average |
| Operating margin, terminal | 18.0 | % of revenue | Own estimate, anchored to segment note | — | Below the best year, above the worst |
| Tax rate | 21.0 | % | Effective rate, tax note in the annual report | Record the day you read it | Three-year average effective rate |
| Diluted share count | — | millions | Income statement, weighted average diluted | Record the day you read it | Includes stock compensation dilution |
| Net debt | — | currency, millions | Balance sheet, most recent period end | Record the day you read it | Stated as of a specific balance sheet date |
Three rules make the register work. Pull from the primary filing rather than a summary site, because summaries silently restate and reclassify. Record the retrieval date, because filings get amended and prices move. And keep the reason under about eight words — if you cannot compress it, you have not decided what you believe yet. Where a number is your judgement rather than a disclosure, write “own estimate” in the source column and name the anchor you reasoned from. Marking an estimate as an estimate costs you nothing and buys a great deal of credibility.
Sensitivity: prove the conclusion is not a coincidence
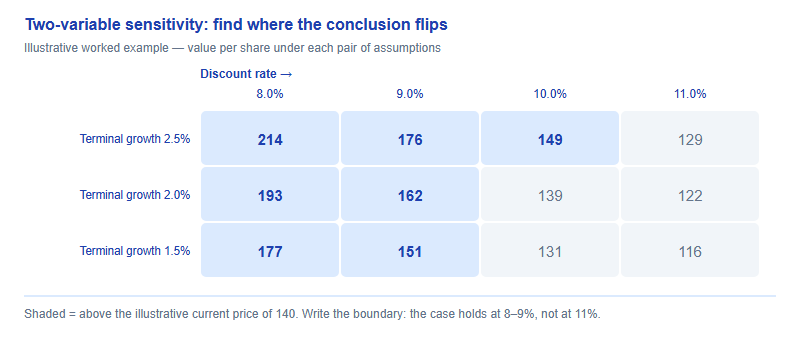
A single valuation output is a coincidence of assumptions. Sensitivity analysis is how you show it is not. Run it in two passes.
The first pass is one variable at a time. Take each major driver, move it to a plausible low and a plausible high, and record what happens to the output. What you are hunting for is the driver that dominates — the one where a small move swings the answer most. That driver deserves a paragraph of evidence in the report; the rest deserve a line each.
The second pass is the two-variable grid: your dominant driver on one axis, the discount rate or terminal growth on the other. The reading you want to write is not “the model gives a value of X” but a boundary statement: the case survives at a discount rate up to here, and stops working above there. That sentence is worth more than a point estimate, because it tells a reader precisely how much has to go wrong before you are wrong.
Watch for the grid where every cell supports your conclusion. That is not strength — it means the axes are too narrow. Widen the ranges until the sign flips somewhere on the table, then show the whole thing, including the corner that disagrees with you.
Nine sanity checks before you write a single sentence
Run these in order the first time you get a complete output. Most models fail two or three of them, and the failures are cheap to fix at this stage and expensive to fix after the report is drafted around them.
- Forecast growth against the five-year history. If your forecast is far above it, name the reason inside the report.
- Forecast margin against the company's own best-ever year and against disclosed peers. Terminal margins above the historical peak need an argument, not a slider.
- The implied exit multiple. Back out what your terminal value implies and compare it with the company's own trading history.
- Reinvestment consistent with growth. Growth without capital going in is a modelling artefact.
- Diluted share count, not basic, and check whether it drifts up over time from stock compensation.
- Currency consistency from the top line to the per-share number.
- Per-share arithmetic ties: equity value divided by shares equals what the output sheet displays.
- Net debt stated as of a specific balance sheet date, with the date written down.
- Every figure the report quotes exists on the output sheet, and every output cell traces to an input.
From cell to sentence
The last stage is translation, and it has its own discipline. Do not write a value of 147.32 per share. A model built on a forecast margin you estimated to the nearest whole point cannot support two decimal places, and false precision reads as inexperience to anyone who has built one. Write the mid-140s, or a range, and let the sensitivity table carry the detail.
Keep version discipline as well: date-stamp file names, never overwrite the copy you sent for feedback, and freeze a snapshot whenever the model informs something you submit. If the season includes a written review stage, that frozen copy is what lets you answer “what changed since the draft?” with specifics.
Finally, do not assume that any of the mechanics here transfer to other contests. Deliverables, permitted tools and appendix rules vary by competition — if you are considering a second entry elsewhere, our side-by-side with the Wharton Global High School Investment Competition sets out how differently the two are structured. For the SIC itself, the current season's rules on submission format and permitted assistance are on the official site, and they are the only version that counts.
FAQ
Do I have to submit my spreadsheet to the judges?
Submission formats are set each season. Check the current rules on the official SIC site, and build the workbook as though it could be shared.
Is Excel required, or can I use Google Sheets?
Either is fine. What matters is the separation of inputs from formulas, plus a sensitivity table a reader can follow unaided.
How many scenarios should I model?
Three named cases is usually enough. Each should be driven by different inputs, not by nudging the final number until it looks right.
What if my model disagrees with my thesis?
Say so in writing, and explain which one you trust. A stated disagreement reads far stronger than a model quietly tuned to fit.
Published by the SIC editorial desk, operated by Hanlin Education for China-based international-school students. Official rules are set by the competition and change from year to year — confirm current details on the official SIC site. Errors are corrected within 7 working days.