Most SIC analysts learn one chain: revenue, gross margin, operating margin, free cash flow, then a multiple or a discounted cash flow. It works for the majority of listed companies because most companies sell a product at a markup. Banks, REITs, pre-revenue biotech and deep cyclicals each break a different assumption in that chain, and applying it anyway produces confident numbers that a judge can dismantle in one question.
The default toolkit has hidden assumptions
The standard framework quietly assumes four things. That revenue precedes profit, so there is a margin to analyse. That the balance sheet finances operations rather than being the operations. That reported depreciation approximates real economic wear on assets. And that current earnings are broadly representative of normal earnings, so a trailing multiple means something.
Each of those is true for a software firm, a consumer brand or an industrial with a stable order book. Each is false for at least one sector students routinely pitch. The failure is rarely arithmetic — the model computes fine. The failure is that the output is meaningless, and worse, that the risk section ends up phrased in metrics that could never have moved in the first place. That costs points on two axes at once: evidence quality, because the method does not fit the evidence, and risk articulation, because the kill criteria are unfalsifiable in practice.
None of this requires advanced finance. It requires noticing which assumption your company breaks and swapping in the measure the industry itself uses — the measure that appears in the company’s own filings and on its own earnings calls.
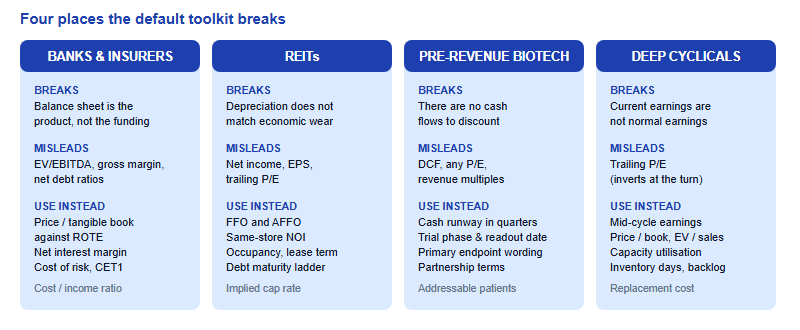
Banks and insurers: the balance sheet is the product
For an industrial company, debt is how you finance the factory. For a bank, deposits and loans are the factory. That single difference invalidates a surprising amount of the standard kit. Enterprise value, which adds net debt to market capitalisation, is not meaningful when borrowing is raw material rather than financing, so EV/EBITDA has no interpretation. There is no gross margin because there is no cost of goods sold in the usual sense.
What replaces it is the vocabulary banks use in their own filings. Net interest margin captures the spread between what the bank earns on assets and pays on funding. The cost-to-income ratio measures operating efficiency. Return on tangible equity tells you what the equity base actually generates, and it is the number that anchors valuation: banks are typically valued on price to tangible book value, cross-checked against ROTE, on the logic that a bank earning consistently above its cost of equity should trade above book and one earning below should not.
Two further items carry most of the downside. Cost of risk — loan loss provisions as a share of the loan book — is the earnings line that moves most violently in a downturn. And the CET1 capital ratio is the regulatory constraint that determines whether the bank can keep paying dividends and buying back shares, or has to raise equity and dilute you. Both are disclosed quarterly, which makes them ideal for the falsifiable phrasing the rubric wants: a kill criterion tied to cost of risk exceeding a stated level for two consecutive quarters is checkable by anyone reading the next filing.
REITs: why net income understates the cash
Accounting rules require property owners to depreciate buildings on a fixed schedule. Well-maintained real estate in a decent location frequently does not lose value that way, and sometimes appreciates. The result is a large non-cash charge that pushes reported net income well below the cash the portfolio actually throws off — which is why P/E on a REIT tends to look absurd and tells you nothing.
The industry’s answer is funds from operations, which adds back real estate depreciation and strips out gains on property sales, and adjusted funds from operations, which then subtracts the recurring capital spending needed to keep buildings leasable. AFFO is the closer approximation of distributable cash and the better anchor for a dividend-focused thesis. Both are non-GAAP measures, so cite the reconciliation table in the filing rather than a number from a screener — an unreconciled FFO figure is exactly the kind of decorative citation the evidence axis penalises.
Around that, the operating picture is driven by occupancy, weighted average lease term, and same-store net operating income growth, which strips out the effect of acquisitions so you can see whether the existing portfolio is actually improving. The balance sheet risk is a maturity ladder: with property companies, the question is rarely whether debt exists but when it comes due and at what rate it will be refinanced. A thesis that ignores the maturity schedule has ignored the most probable source of a nasty surprise.
Pre-revenue biotech: nothing to discount
A clinical-stage biotech with no approved product has no revenue, negative earnings by construction, and cash flows that depend on binary scientific events years out. Running a discounted cash flow on it is assumption-stacking dressed as arithmetic: change the probability of success by ten percentage points and the valuation can swing by half again or more, which means the model is reporting your prior, not the company’s worth.
The honest analysis is different in kind. It starts with cash runway — cash and equivalents divided by quarterly operating burn — because a company that runs out of money before its readout will raise equity on bad terms regardless of the science. It continues with the pipeline as a set of dated events: which trial, which phase, what the primary endpoint actually says, and when data is expected. It reads partnership and royalty terms, because a licensing deal can mean the upside you are underwriting mostly accrues to someone else.
The compensation is that biotech gives you the cleanest risk section in the competition. Most theses have fuzzy failure conditions; this one has a binary, dated, publicly observable event. “If the Phase 3 trial misses its primary endpoint at the readout expected in the second half of the year, the thesis is void” is precisely the metric-threshold-timeframe structure the risk axis rewards. If you do use probability-weighted valuation, present the probability as an input you sourced and can defend, not as precision — and state where it came from.
Deep cyclicals: a low P/E is often the sell signal
Shipping, chemicals, memory semiconductors, steel, mining, autos: industries where demand and pricing swing hard around a long-run average. Here the standard multiple does not merely mislead, it inverts. At the top of a cycle, earnings are inflated by peak pricing and full utilisation, so the trailing P/E looks cheapest exactly when the risk is highest. At the bottom, depressed earnings make the P/E look expensive, or infinite, precisely when the asset is cheapest against replacement cost.
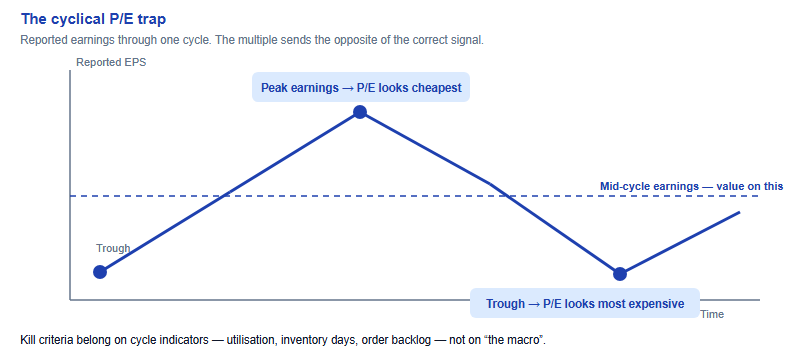
The workaround is normalisation: estimate what the business earns in an average year, using a full cycle of history where possible, and value on that. Price to book and enterprise value to sales are more stable cross-checks because the denominators swing less than earnings do. Then track the cycle with physical indicators rather than sentiment — capacity utilisation, inventory days, order backlog, day rates or spot prices, and whether the industry is adding capacity. New supply arriving is the classic signal that the good times are ending, and it is observable well before it shows up in earnings.
The exception map, and how to declare your method
| Sector | Assumption it breaks | Metric that misleads | What to use instead | A falsifiable risk trigger |
|---|---|---|---|---|
| Banks & insurers | Balance sheet funds operations | EV/EBITDA, gross margin | P/TBV against ROTE; NIM; cost of risk; CET1 | Cost of risk above a stated level for two consecutive quarters |
| REITs | Depreciation tracks economic wear | Net income, EPS, trailing P/E | FFO and AFFO; same-store NOI; occupancy; maturity ladder | Same-store NOI growth turns negative for two consecutive quarters |
| Pre-revenue biotech | Revenue precedes profit | DCF output, any earnings multiple | Cash runway; trial phase and readout date; endpoint definition | Primary endpoint missed at the next scheduled readout |
| Deep cyclicals | Current earnings are normal earnings | Trailing P/E | Mid-cycle EPS; P/B; EV/sales; utilisation; backlog | Industry capacity additions exceed a stated level over the next year |
| High-growth software (partial) | Reported profit reflects economics | GAAP net income while stock compensation is large | Net revenue retention; growth plus margin together; dilution per year | Net revenue retention falls below a stated level for two quarters |
Finally, say what you are doing. One sentence in a methodology note converts an unusual choice from a suspected error into visible judgment: for example, that because the subject is a bank you value on price to tangible book against return on tangible equity rather than EV/EBITDA, since enterprise value is not meaningful where borrowing is an input to operations. That single line pre-empts the obvious defense question, demonstrates you understand why the default does not apply, and reads as exactly the kind of evidence-quality maturity the rubric describes.
The reverse also holds: silently using the wrong measure and hoping nobody notices is the weakest available option, because these sectors are exactly the ones where a reader who knows the industry will notice a mismatched method. If you are choosing a subject now, the SIC overview sets out how the Senior report and Junior portfolio tracks differ, and the comparison with the Wharton competition explains why SIC’s non-ranked, rubric-scored recognition tolerates — and rewards — the harder sector rather than the safest one.
Should beginners avoid banks and biotech entirely?
Not necessarily. They demand a different toolkit, not a harder one, and they often produce sharper, more falsifiable risk sections than a generic consumer pitch.
Is it acceptable to use a non-GAAP measure like FFO?
Yes, when the industry reports it. Cite the reconciliation table in the company filing rather than a screener figure, so a reader can verify it quickly.
How do I estimate mid-cycle earnings for a cyclical?
Average margins or returns across a full historical cycle from the filings, apply them to current revenue or capacity, and state the window you used.
Do judges expect professional-level sector knowledge?
No. They expect you to notice the default method does not fit and to say why, in one clear methodology sentence.
Published by the SIC editorial desk, operated by Hanlin Education for China-based international-school students. Official rules are set by the competition and change yearly — confirm current details, deadlines and formats on the official SIC site. Errors reported to the desk are corrected within 7 working days.