The Senior Division brief sets a length range and a subject, not an architecture: teams of 2–4 produce one 15–30 page investment strategy report. Nothing in the published rules tells you what goes on page 3. That freedom is where most avoidable points disappear. Deciding a page budget in week one, mapped to the four 25-point rubric axes, is the cheapest scoring decision a team makes all season.
What the page range constrains — and what it does not
Two things are fixed by the published brief. First, the deliverable: a Senior team of 2–4 students submits a single strategy report defending one company, sector, or macro position, in the 15–30 page range, at roughly 5–8 hours per member per week during the Regional Stage. Second, the scoring frame: the four-axis rubric awards 25 points each to thesis clarity, evidence quality, risk articulation and revision discipline, and it is published in advance and held constant across the season. Season-specific requirements can change year to year, so confirm the current brief on the official SIC site before you lock anything.
What is not fixed is everything that actually determines how a judge experiences your work: section order, how much room each argument gets, whether a number appears in prose or in a checkable exhibit, and whether your risk analysis is structurally connected to your valuation or bolted on at the end. Two teams can do identical research and score differently on all four axes purely on those choices.
One consequence worth internalising early: length is not a quality signal. A 30-page report with the thesis buried on page 6 loses clarity points that a disciplined 17-page report keeps. Judges read a large number of submissions; the report that makes its bet legible fastest is not being lucky.
A page budget mapped to the four rubric axes
The allocation below is our editorial desk’s working recommendation for a 24-page report — the middle of the permitted range — not an official requirement. Adapt the proportions; keep the principle, which is that each axis worth 25 points should command roughly a quarter of your page space and a quarter of your team’s hours.
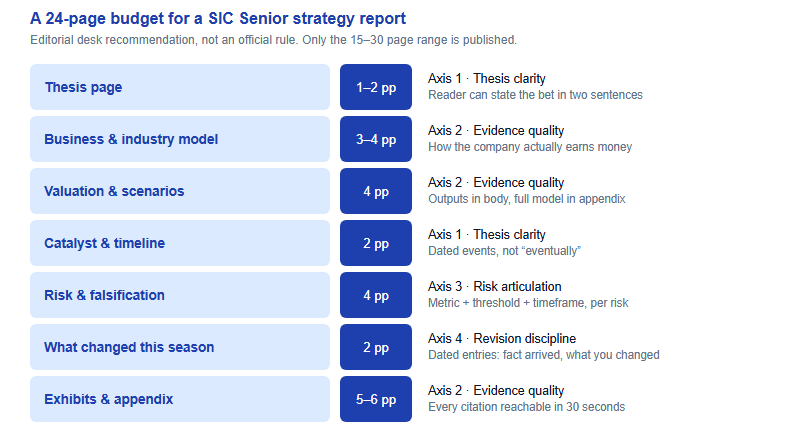
| Section | Pages (of 24) | Primary rubric axis | What a judge should be able to do after reading it |
|---|---|---|---|
| Thesis page | 1–2 | Thesis clarity | Restate your bet, the mechanism and the falsification point without turning a page |
| Business & industry model | 3–4 | Evidence quality | Explain where revenue comes from and which two or three variables drive it |
| Valuation & scenarios | 4 | Evidence quality | See your base, bear and bull outputs and the assumption each hinges on |
| Catalyst & timeline | 2 | Thesis clarity | Name a dated event that would move the market’s view toward yours |
| Risk & falsification | 4 | Risk articulation | Point to the exact metric, threshold and window that would kill the thesis |
| What changed this season | 2 | Revision discipline | Trace which facts arrived and what you revised in response |
| Exhibits & appendix | 5–6 | Evidence quality | Verify any number in the body against a primary source in under a minute |
The first two pages decide your clarity score
The clarity axis asks a blunt question: can a non-expert grasp the investment bet in two sentences? The desk’s working instruction is to write your thesis as if it were the headline of a wire story — claim first, qualification second. Twenty-five points ride on a page you can rewrite in an afternoon.
Write it last, place it first. Until the valuation and risk work is done you do not actually know what your thesis is, so drafting the thesis page in week two produces a claim you will spend the rest of the season quietly contradicting. Draft it after the analysis, then let it govern everything upstream of it.
The structure that consistently reads well is short: one sentence of claim, one sentence of mechanism, then three or four bullets covering why the market disagrees, what has to happen, and what would prove you wrong. Then stop. Resist the instinct to open with three pages of industry history — that “warm-up” is the single most common structural deduction, because a judge reaches page 4 still unsure what you are arguing.
Test it before submission: hand page 1 to a classmate who does not study finance and ask them to state your bet, the mechanism and the disproof condition. If they cannot do it inside a minute, the problem is on your page, not in their head. This is also the page that carries you into a defense conversation, so the phrasing you can say out loud is the phrasing to keep.
Body, exhibit, or appendix: where each claim belongs
The evidence axis names its preferred sources: 10-Ks, earnings transcripts, central bank minutes and primary research, rather than blog summaries, forum threads or second-hand “as reported by” citations. The desk’s verification standard is that if a reader cannot reach the underlying source in about thirty seconds, the citation is decorative. Structure is how you make that standard easy to meet.
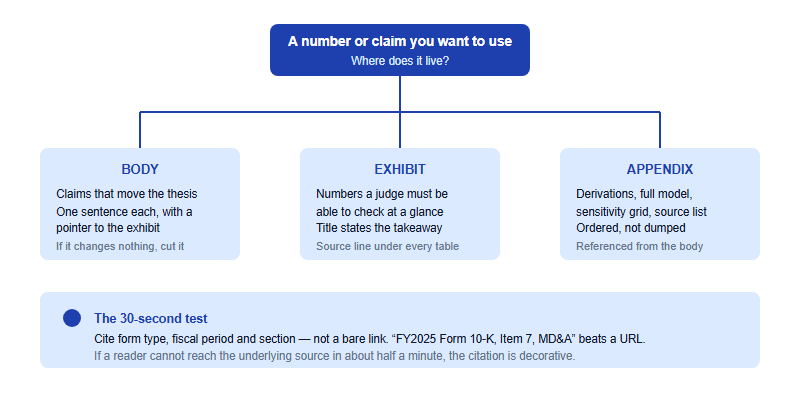
Two habits follow from this. First, never state a computed number in prose without an exhibit behind it — a growth rate quoted in a sentence with no table is a number a judge cannot verify, and in our experience unverifiable numbers read as weaker than absent ones. Second, title exhibits with their conclusion. “Exhibit 4: Revenue” makes the reader do your work; “Exhibit 4: Subscription revenue growth has halved since FY2023” carries the argument even when skimmed.
Designing the risk section into the skeleton
The risk axis rewards specificity in falsifiable terms: a metric, a threshold and a timeframe. The published illustration of adequate framing is of the form “if gross margin compresses below 38% in two consecutive quarters” — concrete enough that a reader could check it against a future filing. “If the macro turns” earns nothing.
The structural point most teams miss is that the risk section must run on the same variables as the valuation section. If your model is driven by average revenue per user and store count, but your risk pages discuss competitive intensity and regulation in the abstract, the two halves of the report are not talking to each other, and a defense question will find the seam within a minute. Build the connection deliberately: for each of the two or three assumptions your valuation is most sensitive to, write one kill criterion.
- Reserve the pages in week one. Risk written in the last forty-eight hours is always vague, because vagueness is what a tired team produces.
- Use a kill-criteria table. Three to five rows: risk, the metric that would show it, the threshold, the window, and what you would do. This is the single highest-density scoring element in the report.
- Include a risk you cannot hedge. Teams that only list risks they have already neutralised read as evasive rather than rigorous.
- Size, don’t just list. Say which risk would cost the most if it landed, and roughly how much of your upside it removes.
Making revision visible — and four structural failures that cost points
The fourth axis asks whether you updated your analysis when the facts changed. A report that shows no movement across a five-month season looks either lucky or unexamined, and the failure pattern the desk sees most often is the reverse: a confident final thesis that quietly mutated across the season to match whatever the evidence later favoured. Structure is the antidote, because a documented change is auditable and a silent one is not.
Give it two pages. Dated entries, each with three fields: what fact arrived, what you changed, and what you deliberately did not change and why. That last field is the one that separates judgment from drift — showing that a piece of bad news arrived, you examined it, and concluded it did not touch the mechanism is a stronger signal than showing you revised every time the price moved. Junior Division participants file weekly thesis logs by design; Senior teams should keep an internal equivalent from the first week of the Regional Stage, because you cannot reconstruct a season of reasoning in the final fortnight.
Four structural failures worth checking for before you submit:
- The appendix as a dumping ground. Unreferenced material reads as padding. If nothing in the body points to it, cut it.
- Two authors, two voices. With a team of 2–4 splitting sections, appoint one editor for the final pass. Tonal seams undermine clarity even when every paragraph is individually fine.
- Page inflation. Stretching to 30 pages because the range allows it converts a tight report into a loose one and gains nothing.
- Orphan exhibits. A chart nobody references is a chart nobody reads. Every exhibit should be called out by number in a sentence that says what it proves.
If you are still deciding whether the Senior report route fits you at all, the overview of what SIC is sets out the division structure and season shape, and the side-by-side with the Wharton competition explains why a rubric-scored research programme and a ranked, tournament-format challenge reward completely different work.
Does SIC publish a required report structure?
No. The brief sets a 15–30 page range for Senior teams; internal architecture is your choice. Confirm current requirements on the official site.
Is a 30-page report better than a 17-page one?
No. Length is not scored. A shorter report with a clear thesis and checkable exhibits outscores a padded one on every axis.
Where should the full valuation model go?
In the appendix. Put the base, bear and bull outputs plus the sensitivity that matters in a body exhibit judges can read at a glance.
How many pages should the risk section get?
Treat it as roughly a quarter of the report, matching its 25-point weight, and run it on the same metrics as your valuation.
Published by the SIC editorial desk, operated by Hanlin Education for China-based international-school students. Official rules are set by the competition and change yearly — confirm current details, deadlines and formats on the official SIC site. Errors reported to the desk are corrected within 7 working days.