A financial ratio takes two numbers from a company’s statements and turns them into a judgement: can this business pay its bills, survive its debt, earn a good return, and use its assets well? For the Student Investment Challenge (SIC), ratios are how you move from quoting figures to arguing about quality. This toolkit covers the four families that matter, how to read them together, and the red flags that give a thesis away.
Why ratios beat raw numbers
A company that earned 500 million in profit tells you almost nothing on its own. Earned on what — 2 billion of sales or 200 billion of assets? Ratios supply the missing denominator. They let you compare a giant to a small-cap, this year to last year, and one industry to another on a level footing. That comparability is exactly what a judge needs to follow your reasoning.
If the competition format is still new to you, our overview of what the SIC is sets the scene; treat ratios as the analytical vocabulary underneath every pitch. A number becomes an argument the moment you put it in ratio form and ask whether it is good, and compared with what.
| Family | Example ratios | The question it answers | Watch out for |
|---|---|---|---|
| Liquidity | Current ratio, quick ratio | Can it pay short-term bills? | Very high can mean idle, lazy cash |
| Leverage | Debt-to-equity, interest coverage | Can it survive its debt load? | Safe levels differ sharply by industry |
| Profitability | Gross, operating and net margin, ROE, ROIC | Is the business actually good? | ROE can be flattered by heavy debt |
| Efficiency | Asset turnover, inventory turnover, receivable days | Does it use its assets well? | Seasonal cycles distort a single snapshot |

Liquidity and leverage: can the company survive?
Before you ask whether a company is a good investment, ask whether it will still be standing. Liquidity ratios test short-term survival. The current ratio compares current assets to current liabilities; the quick ratio strips out inventory to see whether the most liquid assets alone can cover near-term debts. A ratio comfortably above 1 usually signals breathing room, though an unusually high figure can also mean management is hoarding cash it could deploy.
Leverage ratios test longer-term survival. Debt-to-equity shows how much of the balance sheet is financed by borrowing versus owners, and interest coverage — operating profit divided by interest expense — shows how easily current earnings service that debt. The critical discipline here is context: a utility with steady cash flows can safely carry debt that would sink a cyclical manufacturer. Never call leverage “high” or “low” without naming the industry you are comparing against.
Profitability and efficiency: is the business any good?
Survival is the floor; quality is the ceiling. The margin ladder — gross, operating, then net margin — shows where money leaks out as revenue travels down the income statement. A wide gross margin that collapses by the net line points to heavy operating or interest costs worth investigating. Return on equity (ROE) and return on invested capital (ROIC) then ask the deeper question: how much profit does the company generate on the capital entrusted to it?
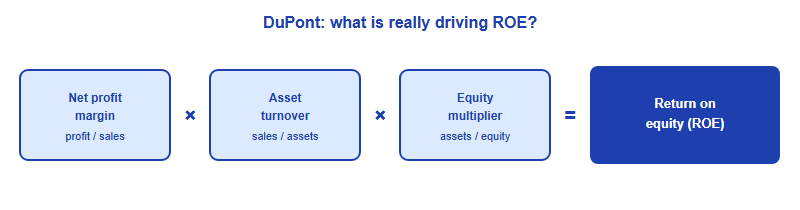
ROE deserves special care because it can flatter a fragile business. A company can lift ROE simply by taking on more debt, not by getting better at its job. This is why analysts break ROE into its drivers using the DuPont framework: profit margin, asset turnover, and financial leverage. Splitting the ratio tells you whether a strong ROE was earned through genuine profitability and efficiency, or borrowed through the balance sheet.
Efficiency ratios round out the picture. Asset turnover measures sales generated per unit of assets; inventory turnover and receivable days show how quickly the company converts stock and credit sales back into cash. Falling turnover or lengthening collection times can be early warnings that trouble is building before it reaches the profit line.
The golden rule: no ratio stands alone
A single ratio is a data point, not a conclusion. To make it mean something, read it three ways at once: against the company’s own history to spot a trend, against close competitors to gauge relative standing, and against the business model to check whether the level even makes sense. A retailer and a software firm should have very different asset turnover, and comparing them directly would mislead rather than inform.
- Trend — is the ratio improving or deteriorating over three to five years?
- Peers — where does it sit against genuinely comparable companies, not famous names?
- Context — does the level fit the industry, the cycle, and the company’s stage?
This is precisely the reasoning that scoring rewards. Our breakdown of the SIC rubric shows why examiners value analysis that connects the numbers rather than listing them, and because the SIC is built around reasoned theses rather than raw trading, this analytical depth carries real weight — a point our comparison of the SIC and the Wharton competition explores.
Benchmarks shift by industry
The most common ratio mistake is importing a benchmark from one industry into another. There is no universal “healthy” number, because different business models are built differently on purpose. The same debt level that would flash red for a software firm is routine for a bank; the razor-thin net margin that would worry you in most sectors is normal in high-volume retail. Before you judge a ratio, ask what “normal” looks like for this specific type of business.
- Banks and insurers — leverage looks alarming by ordinary standards but is inherent to the model, so weigh capital adequacy and asset quality rather than a plain debt-to-equity figure.
- Software and internet — asset-light, so inventory and asset-turnover ratios say little; margins, customer retention, and cash conversion tell the real story.
- Retail and consumer — thin margins are expected, so inventory turnover and sales density often matter more than net margin on its own.
- Utilities and heavy industry — capital-intensive and slow-turning, so steady interest coverage and return on invested capital carry more weight than rapid turnover.
The practical rule follows directly: build your peer set from genuinely similar businesses, then judge every ratio against that set and the company’s own trend. A ratio is only ever “good” or “bad” relative to the right comparison, and choosing that comparison well is half the analysis.
Ratio red flags we see in SIC drafts
As the China and Asia editorial desk for the SIC, we read the same avoidable ratio errors again and again. Catch them before you submit.
- One snapshot, no trend. Quoting this year’s ratio without showing the three-year direction hides the story.
- Praising ROE without DuPont. Celebrating a high ROE that is really just a lot of debt in disguise.
- Cross-industry comparisons. Judging a bank’s leverage against a software firm’s, when the norms are worlds apart.
- Ignoring the cash-flow check. Strong reported margins mean little if cash from operations is not following the profit.
- Ratio dumping. Listing a dozen ratios with no argument, instead of choosing the three that actually decide the thesis.
Frequently asked questions
Which ratios matter most for a SIC pitch?
There is no fixed list. Pick the few that drive your specific thesis and explain why, rather than dumping every ratio you can calculate.
What is a “good” current ratio or debt-to-equity?
It depends entirely on the industry. Compare against close peers and the company’s history, not a universal benchmark.
Why break ROE into the DuPont parts?
Because a high ROE can come from real profitability or just heavy borrowing. DuPont shows which, so you do not misjudge quality.
Do ratios replace a valuation?
No. Ratios judge business quality and risk; valuation judges price. A strong thesis uses both together.
Published by the SIC editorial desk, operated by Hanlin Education for China-based international-school students. Official rules are set by the competition and change yearly — confirm current details on the official SIC site. Any error will be corrected within 7 working days.